Raj Television

  • Market Cap: Micro Cap
  • Industry: Media & Entertainment
  • ISIN: INE952H01027
  • NSEID: RAJTV
  • BSEID: 532826
INR
8.98
-0.47 (-4.97%)
BSENSE

Sep 02, 03:32 PM

BSE+NSE Vol: 51.11 k

  • Price Points
  • Score
  • Mojo Parameters
  • Total Return
  • News and Corporate Actions
  • Key factors
  • Shareholding
  • Financials
  • CompanyCV
stock-summaryPrice Point
High/Low

1Day

52 Week

Valuation
Technical
Day's Volume

CASH

51.11 k (10.14%) Volume

Shareholding (Jun 2026)

FII

0.02%

Held by 1 FIIs

DII

0.00%

Held by 0 DIIs

Promoter

70.96%

Why is Raj Television Network Ltd falling/rising?

02-Sep-2026

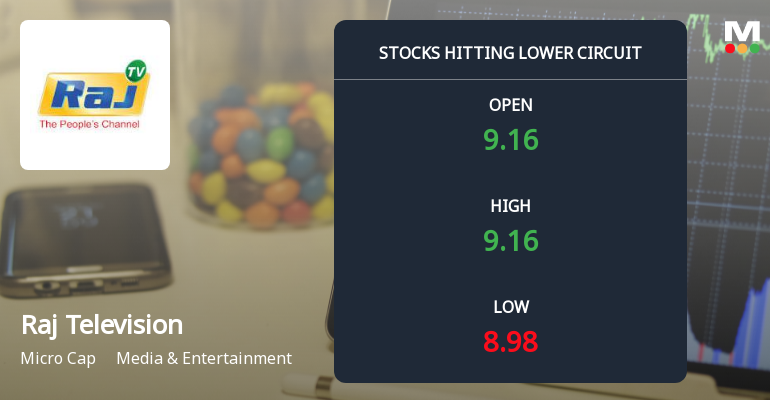
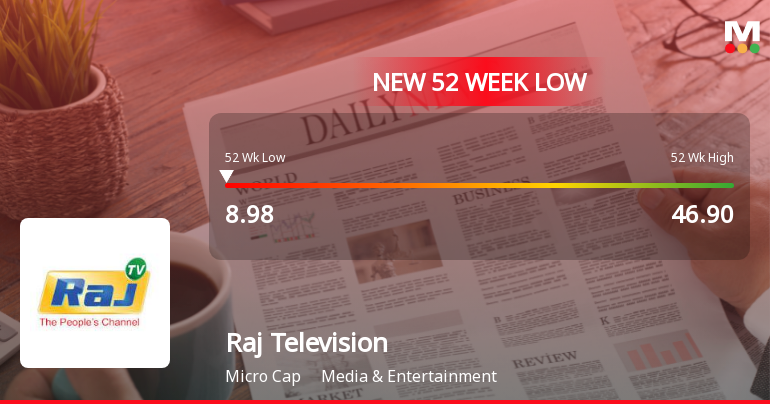
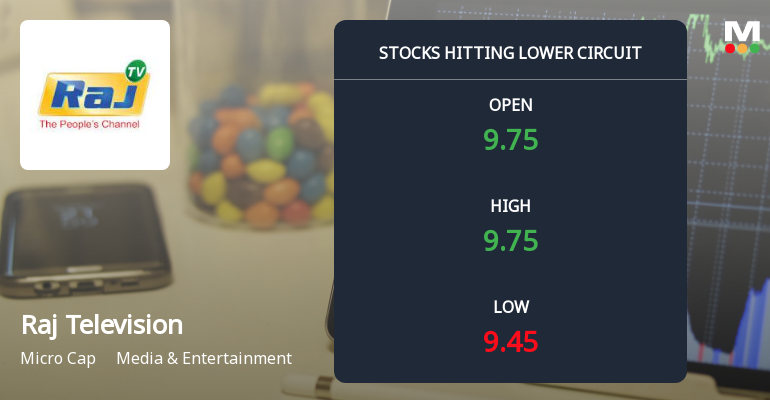
As of 01-Sep, Raj Television Network Ltd's stock price is at Rs. 9.45, marking a 4.93% decline and a new 52-week low. The company has faced significant financial challenges, including a year-to-date drop of 78.02% and ongoing operating losses, leading to a negative sentiment despite some positive investor activity.

As of 01-Sep, Raj Television Network Ltd's stock price is falling, currently at Rs. 9.45, which represents a decline of Rs. 0.49 or 4.93%. The stock has hit a new 52-week low today and has been on a downward trend, having lost 10.43% over the last four days. This consistent decline is reflected in its performance metrics, showing a significant underperformance against the benchmark Sensex, which has only decreased by 0.92% over the same period.<BR><BR>The stock's performance over various time frames indicates a troubling trend, with a year-to-date decline of 78.02% and a one-year drop of 77.86%. Additionally, the company has reported operating losses and has declared negative results for the last four consecutive quarters, including a drastic fall in net sales of 29.78%. The company's financial health is further compromised by a weak ability to service its debt, as evidenced by a poor EBIT to Interest ratio of -0.36.<BR><BR>Despite some positive factors, such as an attractive valuation and rising investor participation reflected in a significant increase in delivery volume, these have not been sufficient to counteract the negative sentiment surrounding the stock. The overall weak long-term fundamental strength of the company, coupled with consistent underperformance against the benchmark over the last three years, contributes to the stock's decline.

View full answer

Who are in the management team of Raj Television?

01-Sep-2026

The management team of Raj Television includes M Raajhendhran (Chairman & Managing Director), M Rajarathnam (Director of Distribution), M Ravindran (Director of Operation), M Raghunathan (Director of Marketing), and several independent directors, along with Namratha as Company Secretary & Compliance Officer. Together, they oversee the company's operations and strategic direction.

The management team of Raj Television includes the following key members:<BR><BR>1. **M Raajhendhran** - Chairman & Managing Director<BR>2. **M Rajarathnam** - Director (Distribution)<BR>3. **M Ravindran** - Director (Operation)<BR>4. **M Raghunathan** - Director (Marketing)<BR>5. **R. Rajagopalan** - Independent Director<BR>6. **Mohan Kameswaran** - Independent Director<BR>7. **R. Vijayalakshmi** - Director<BR>8. **S Venkateswaran** - Independent Director<BR>9. **Bharathi Sridhar** - Independent Director<BR>10. **Namratha** - Company Secretary & Compliance Officer<BR><BR>These individuals play various roles in guiding the company's operations and strategic direction.

View full answer

What does Raj Television do?

01-Sep-2026

Raj Television Network Ltd, or Raj TV, is an entertainment broadcaster in the Micro Cap market, reporting net sales of 15 Cr and a net loss of 1 Cr for June 2026, with a market cap of INR 53 Cr. The company has a debt-equity ratio of 0.16 and a return on equity of -0.46%.

Overview:<BR>Raj Television Network Ltd, commonly known as Raj TV, operates as a premier entertainment broadcaster in the Media & Entertainment industry within the Micro Cap market-cap bracket.<BR><BR>History:<BR>Raj Television Network Ltd was incorporated in an unspecified year and has maintained its status as a key player in the entertainment sector. The latest quarterly results reported are for June 2026, showing net sales and profit figures.<BR><BR>Financial Snapshot:<BR>- Net Sales: 15 Cr (Quarterly Results - Jun 2026)<BR>- Net Profit: -1 Cr (Quarterly Results - Jun 2026)<BR>- Market-cap value: INR 53 Cr (Micro Cap)<BR><BR>Key Metrics:<BR>- P/E: N/A<BR>- Industry P/E: 17<BR>- Dividend Yield: 0.00%<BR>- Debt Equity: 0.16<BR>- Return on Equity: -0.46%<BR>- Price to Book: 0.44<BR><BR>Contact Details:<BR>- Address: No 32 Poes Road IInd Street, Teynampet Chennai Tamil Nadu : 600018<BR>- Tel: 91-44-24351898/2926<BR>- Email: administator@rajtvnet.in<BR>- Website: http://www.rajtvnet.in

View full answer

Who are the peers of the Raj Television?

01-Sep-2026

Raj Television's peers include Cinevista, Baba Arts, G V Films, Siti Networks, Moving Media, Maxposure, Studio LSD, Digikore Studios, and Baweja Studios L. Raj Television has below average management and growth, with a 1-year return of -76.01%, the lowest among its peers.

Peers: The peers of Raj Television are Cinevista, Baba Arts, G V Films, Siti Networks, Moving Media, Maxposure, Studio LSD, Digikore Studios, and Baweja Studios L.<BR><BR>Quality Snapshot: Below Average management risk is observed at Cinevista, Baba Arts, G V Films, Raj Television, Siti Networks, Studio LSD, and Baweja Studios L, while Good management risk is found at Moving Media and Digikore Studios. Average management risk is noted at Maxposure. Good growth is seen at Cinevista and Digikore Studios, while Average growth is present at G V Films and Moving Media. Below Average growth is reported for Baba Arts, Raj Television, Siti Networks, Studio LSD, and Baweja Studios L, and Average growth is noted at Maxposure. Below Average capital structure is found at Cinevista, G V Films, Raj Television, Siti Networks, and Baweja Studios L, while Good capital structure is observed at Moving Media and Digikore Studios, and Excellent capital structure is noted at Maxposure.<BR><BR>Return Snapshot: Baba Arts has the highest 1-year return at 79.59%, while Raj Television has the lowest at -76.01%, indicating a significant negative performance compared to its peers. Additionally, Siti Networks, Moving Media, Maxposure, Studio LSD, Digikore Studios, and Baweja Studios L all report a six-month return of 0.00%.

View full answer

How big is Raj Television?

01-Sep-2026

As of 31st August, Raj Television Network Ltd has a market capitalization of 53.00 Cr and reported net sales of 68.44 Cr with a net loss of 0.57 Cr over the latest four quarters. Shareholder's funds were 123.53 Cr, and total assets were 183.14 Cr as of March 2025.

As of 31st August, Raj Television Network Ltd has a market capitalization of 53.00 Cr, categorizing it as a Micro Cap company.<BR><BR>In the latest four quarters, Raj Television reported net sales of 68.44 Cr. However, it experienced a net loss of 0.57 Cr during the same period.<BR><BR>The latest annual reporting period for the balance sheet is March 2025. Shareholder's funds were recorded at 123.53 Cr, while total assets amounted to 183.14 Cr.

View full answer

Should I buy, sell or hold Raj Television Network Ltd?

13-Aug-2026

Are Raj Television Network Ltd latest results good or bad?

13-May-2026

Raj Television Network Ltd's latest results show a 340% quarter-on-quarter profit increase and a 30.08% revenue rise, indicating some recovery. However, year-on-year revenue has declined by 1.89%, and the company faces ongoing financial challenges, including a significant drop in revenue and low return on equity, leading to a cautious outlook.

Raj Television Network Ltd's latest results present a mixed picture. In Q4 FY26, the company reported a net profit of ₹0.22 crore, which is a significant improvement of 340% quarter-on-quarter. Additionally, revenue increased by 30.08% to ₹21.32 crore compared to the previous quarter. This sequential growth is encouraging, especially after a challenging fiscal year where the company faced substantial losses.<BR><BR>However, when looking at the year-on-year performance, the revenue for Q4 FY26 reflects a decline of 1.89% from ₹21.73 crore in Q4 FY25. Furthermore, the company's financial health is concerning, as it has experienced a dramatic revenue drop of 52.06% in the first half of FY26 compared to the same period in FY25. The operating margin has also significantly compressed, now at just 3.71%, down from much higher levels in previous years.<BR><BR>The return on equity (ROE) stands at a mere 1.25%, indicating weak capital efficiency, and the overall financial metrics suggest that while there is some recovery, the company is still grappling with fundamental challenges in maintaining consistent revenue and profitability.<BR><BR>In summary, while the latest quarterly results show improvement, they are overshadowed by a history of significant losses and ongoing operational difficulties. The outlook remains cautious, and the company faces critical structural challenges in the competitive media landscape.

View full answer

When is the next results date for Raj Television Network Ltd?

06-May-2026

The next results date for Raj Television Network Ltd is 12 May 2026.

The next results date for Raj Television Network Ltd is scheduled for 12 May 2026.

View full answer

How has been the historical performance of Raj Television?

12-Nov-2025

Raj Television has experienced a significant decline in profitability, with a net loss of -21.01 Cr for the fiscal year ending March 2025, despite an increase in net sales to 125.82 Cr. The company's operational efficiency has deteriorated, leading to negative cash flow and a challenging financial position.

Answer:<BR>The historical performance of Raj Television shows a significant decline in profitability and operational efficiency, particularly in the latest fiscal year ending March 2025.<BR><BR>Breakdown:<BR>Raj Television's net sales have increased from 69.26 Cr in March 2022 to 125.82 Cr in March 2025, indicating a positive trend in revenue generation. However, total expenditure has also risen sharply, reaching 145.54 Cr in March 2025, which has led to an operating profit (PBDIT) of -19.48 Cr, a stark contrast to the positive operating profits seen in previous years. The company reported a profit before tax of -24.76 Cr and a profit after tax of -21.01 Cr for March 2025, marking a significant downturn from the previous year's profit of 0.81 Cr. The earnings per share (EPS) have plummeted to -4.05, down from 0.16 in March 2024. On the balance sheet, total liabilities have slightly increased to 183.14 Cr, while total assets have decreased to 183.14 Cr, reflecting a challenging financial position. Cash flow from operating activities has also turned negative at -5.00 Cr, compared to positive cash flows in earlier years, indicating liquidity issues. Overall, the financial metrics suggest that Raj Television is facing considerable operational and financial challenges as of March 2025.

View full answer

Is Raj Television overvalued or undervalued?

09-Jun-2025

As of August 14, 2024, Raj Television's valuation has shifted from fair to risky due to troubling financial ratios, including a PE ratio of -11.36 and an EV to EBITDA of -13.63, indicating it is overvalued and significantly underperforming compared to its peers and the market.

As of 14 August 2024, Raj Television's valuation grade has moved from fair to risky, indicating a significant deterioration in its financial standing. The company is currently assessed as overvalued given its troubling financial ratios, including a PE ratio of -11.36, an EV to EBITDA of -13.63, and a ROE of -16.46%. These figures suggest that the company is struggling to generate profits and is facing negative returns on equity.<BR><BR>In comparison to its peers, Raj Television's valuation metrics are concerning; for instance, its PE ratio is notably worse than the industry average, which typically hovers around positive figures. The company's EV to Sales ratio of 2.14 further underscores its overvaluation relative to competitors in the media and entertainment sector. Additionally, while Raj Television has seen a short-term stock return of 3.86% over the past week, it remains significantly underperforming with a year-to-date decline of 42.54%, contrasting sharply with the Sensex's 5.62% gain during the same period.

View full answer

What is the technical trend for Raj Television?

09-Jun-2025

As of May 23, 2025, Raj Television's technical trend has shifted to bearish, indicated by a bearish MACD, Bollinger Bands, and moving averages, with a year-to-date return of -43.25% compared to the Sensex's 5.51%.

As of 23 May 2025, the technical trend for Raj Television has changed from mildly bearish to bearish. The current stance is bearish with a strong indication of weakness. Key indicators driving this sentiment include a bearish MACD on the weekly chart, bearish Bollinger Bands on both weekly and monthly time frames, and bearish moving averages on the daily chart. The KST is also bearish on the weekly, while the Dow Theory shows a mildly bearish trend on the weekly. The stock has significantly underperformed compared to the Sensex over multiple time frames, particularly with a year-to-date return of -43.25% versus the Sensex's 5.51%.

View full answer

Who are the top shareholders of the Raj Television?

06-Jun-2025

The top shareholders of Raj Television are M Ravindran, the promoter with 11.28%, and Moolchand Kiran Kumar Jain, the highest public shareholder with 20.64%. Individual investors hold a combined 27.75%, with no mutual funds or foreign institutional investors involved.

The top shareholders of Raj Television include M Ravindran, who is the promoter with the highest holding at 11.28%. Additionally, Moolchand Kiran Kumar Jain stands out as the highest public shareholder, holding 20.64%. Individual investors collectively hold 27.75% of the company's shares. There are no mutual funds or foreign institutional investors currently holding shares in the company.

View full answer

What is the bonus history of the Raj Television?

06-Jun-2025

Raj Television Network Ltd announced a 1:1 bonus issue on March 25, 2014, granting shareholders one additional share for each share held, with a record date of March 26, 2014. This is the most recent bonus action recorded for the company.

Raj Television Network Ltd has a bonus history that includes a significant issue announced on March 25, 2014. The company declared a 1:1 bonus issue, which means that shareholders received one additional share for every share they held. The record date for this bonus was March 26, 2014, and the ex-date was the same day as the announcement. This was the latest bonus action recorded for the company. If you have any more questions about Raj Television or need further details, feel free to ask!

View full answer

Has Raj Television declared dividend?

06-Jun-2025

Raj Television Network Ltd has declared a 2% dividend, amounting to 0.1 per share, but the dividend yield is 0%. Total returns have varied, showing significant losses in the short term and modest gains over the long term.

Raj Television Network Ltd has declared a 2% dividend.<BR><BR>Dividend Details:<BR>- Percentage announced: 2%<BR>- Amount per share: 0.1<BR>- Ex-date: 19 Sep 19<BR><BR>Dividend Yield: 0%<BR><BR>Total Returns by Period:<BR>In the 6-month period, the price return was -31.33%, the dividend return was 0%, resulting in a total return of -31.33%.<BR><BR>For the 1-year period, the price return was -61.94%, the dividend return was 0%, leading to a total return of -61.94%.<BR><BR>Over the 2-year period, the price return was -8.68%, with a dividend return of 0%, resulting in a total return of -8.68%.<BR><BR>In the 3-year period, the price return was 13.68%, the dividend return was 0%, which resulted in a total return of 13.68%.<BR><BR>For the 4-year period, the price return was 14.1%, with a dividend return of 0%, leading to a total return of 14.1%.<BR><BR>In the 5-year period, the price return was 26.6%, the dividend return was 0%, resulting in a total return of 26.6%.<BR><BR>Overall, while Raj Television has declared a dividend, the dividend yield remains at 0%, indicating that the dividend payments have not significantly contributed to returns. The total returns over various periods show a mix of negative and positive performance, with substantial losses in the shorter terms and modest gains over the longer term.

View full answer
iScoreScore
Click here to find our call on this stock
Strong Sell
Sell
Hold
Buy
Strong Buy

Dashboard

1

With a Operating Losses, the company has a Weak Long Term Fundamental Strength

  • Company's ability to service its debt is weak with a poor EBIT to Interest (avg) ratio of -0.36
  • The company has been able to generate a Return on Equity (avg) of 0.55% signifying low profitability per unit of shareholders funds
2

With a fall in Net Sales of -29.78%, the company declared Very Negative results in Jun 26

3

Consistent Underperformance against the benchmark over the last 3 years

stock-summaryMojo Parameters

Mojo Parameters

Loading Valuation Snapshot...

Stock DNA

stock-summary
Industry

Media & Entertainment

stock-summary
Market cap

INR 47 Cr (Micro Cap)

stock-summary
P/E

NA (Loss Making)

stock-summary
Industry P/E

17

stock-summary
Dividend Yield

0.00%

stock-summary
Debt Equity

0.16

stock-summary
Return on Equity

-0.46%

stock-summary
Price to Book

0.39

Revenue and Profits:
Net Sales:
15 Cr
(Quarterly Results - Jun 2026)
Net Profit:
-1 Cr
stock-summaryTotal Returns
Total Returns (Price + Dividend) stock-summary
Dividend Yield (0%)
TimePeriod
Price Return
Dividend Return
Total Return
3 Months
-42.1%
0%
-42.1%
6 Months
-76.37%
0%
-76.37%
1 Year
-79.14%
0%
-79.14%
2 Years
-82.57%
0%
-82.57%
3 Years
-81.21%
0%
-81.21%
4 Years
-80.71%
0%
-80.71%
5 Years
-73.97%
0%
-73.97%

Latest dividend: 0.1 per share ex-dividend date: Sep-19-2019

Risk Adjusted Returns v/s stock-summary
Returns Beta
Icon
Beta has not been calculated since enough price history is not available
stock-summaryNews & Corporate Actions

Announcements stock-summary

Announcement under Regulation 30 (LODR)-Newspaper Publication

31-Aug-2026 | Source : BSE

Submission of Newspaper Publication.

Announcement under Regulation 30 (LODR)-Newspaper Publication

12-Aug-2026 | Source : BSE

Submission of Newspaper Publication of Unaudited Financial Results for the quarter ended June 30 2026.

Unaudited Financial Results For The Quarter Ended June 30 2026

11-Aug-2026 | Source : BSE

Please find attached herewith Unaudited Financial Results for the quarter ended June 30 2026.

Corporate Actions stock-summary

stock-summary
BOARD MEETING

No Upcoming Board Meetings

stock-summary
DIVIDEND

Raj Television Network Ltd has declared 2% dividend, ex-date: 19 Sep 19

stock-summary
SPLITS

Raj Television Network Ltd has announced 5:10 stock split, ex-date: 25 Mar 14

stock-summary
BONUS

Raj Television Network Ltd has announced 1:1 bonus issue, ex-date: 25 Mar 14

stock-summary
RIGHTS

No Rights history available

stock-summaryKey Factors

Quality key factors stock-summary

Factor
Value
Sales Growth (5y)
-2.92%
EBIT Growth (5y)
-21.10%
EBIT to Interest (avg)
-0.36
Debt to EBITDA (avg)
Negative Net Debt
Net Debt to Equity (avg)
0.16
Sales to Capital Employed (avg)
0.58
Tax Ratio
5.45%
Dividend Payout Ratio
0
Pledged Shares
0
Institutional Holding
0.02%
ROCE (avg)
-0.27%
ROE (avg)
0.55%

Valuation key factors

Factor
Value
P/E Ratio
NA (Loss Making)
Industry P/E
17
Price to Book Value
0.39
EV to EBIT
43.66
EV to EBITDA
29.05
EV to Capital Employed
0.48
EV to Sales
1.01
PEG Ratio
NA
Dividend Yield
NA
ROCE (Latest)
2.29%
ROE (Latest)
-0.46%

Technicals key factors

Indicator
Weekly
Monthly
MACD
Mildly Bullish
Bearish
RSI
No Signal
Bullish
Bollinger Bands
Bearish
Bearish
Moving Averages
Bearish (Daily)
KST
Mildly Bullish
Bearish
Dow Theory
Mildly Bearish
Mildly Bearish
OBV
Bearish
No Trend
stock-summary Technical Indicator Scale: Bearish, Mildly Bearish, Sideways, Mildly Bullish, Bullish  Turned 
stock-summaryShareholding
Shareholding Snapshot : Jun 2026stock-summary
Shareholding Compare (%holding) stock-summary
Majority shareholders

Promoters

Pledged Promoter Holdings

None

Mutual Funds

Held by 0 Schemes

FIIs

Held by 1 FIIs (0.02%)

Promoter with highest holding

M Ravindran (14.06%)

Highest Public shareholder

Moolchand Kiran Kumar Jain (13.76%)

Individual Investors Holdings

27.45%

stock-summaryFinancial
[
  {
    "link": "quarterly",
    "btn_text": "All Quarterly Results",
    "header": "Quarterly Results Snapshot (Standalone) - Jun'26 - QoQ",
    "rhs": [
      {
        "prefix": "Net Sales ",
        "suffix": "QoQ Growth in quarter ended Jun 2026 is -29.78% vs 30.08% in Mar 2026",
        "dir": -1
      },
      {
        "prefix": "Standalone Net Profit ",
        "suffix": "QoQ Growth in quarter ended Jun 2026 is -559.09% vs 340.00% in Mar 2026",
        "dir": -1
      }
    ],
    "table": {
      "header": [
        "Jun'26",
        "Mar'26",
        "Change(%)"
      ],
      "body": [
        {
          "field": "Net Sales",
          "val1": "14.97",
          "val2": "21.32",
          "chgp": "-29.78%",
          "chgp_class": "negative"
        },
        {
          "field": "Operating Profit (PBDIT) excl Other Income",
          "val1": "-0.37",
          "val2": "0.79",
          "chgp": "-146.84%",
          "chgp_class": "negative"
        },
        {
          "field": "Interest",
          "val1": "0.61",
          "val2": "0.76",
          "chgp": "-19.74%",
          "chgp_class": "positive"
        },
        {
          "field": "Exceptional Items",
          "val1": "0.00",
          "val2": "0.00",
          "chgp": "",
          "chgp_class": "neutral"
        },
        {
          "field": "Standalone Net Profit",
          "val1": "-1.01",
          "val2": "0.22",
          "chgp": "-559.09%",
          "chgp_class": "negative"
        },
        {
          "field": "Operating Profit Margin (Excl OI)",
          "val1": "-2.47%",
          "val2": "3.71%",
          "chgp": "-6.18%",
          "chgp_class": "negative"
        }
      ]
    }
  },
  {
    "link": "half-yearly",
    "btn_text": "All Half Yearly Results",
    "header": "Half Yearly Results Snapshot (Standalone) - Sep'25",
    "rhs": [
      {
        "prefix": "Net Sales ",
        "suffix": " Growth in half year ended Sep 2025 is -47.32% vs 21.00% in Sep 2024",
        "dir": -1
      },
      {
        "prefix": "Standalone Net Profit ",
        "suffix": " Growth in half year ended Sep 2025 is 103.10% vs -6,322.22% in Sep 2024",
        "dir": 1
      }
    ],
    "table": {
      "header": [
        "Sep'25",
        "Sep'24",
        "Change(%)"
      ],
      "body": [
        {
          "field": "Net Sales",
          "val1": "32.33",
          "val2": "61.37",
          "chgp": "-47.32%",
          "chgp_class": "negative"
        },
        {
          "field": "Operating Profit (PBDIT) excl Other Income",
          "val1": "2.43",
          "val2": "-16.60",
          "chgp": "114.64%",
          "chgp_class": "positive"
        },
        {
          "field": "Interest",
          "val1": "1.38",
          "val2": "2.21",
          "chgp": "-37.56%",
          "chgp_class": "positive"
        },
        {
          "field": "Exceptional Items",
          "val1": "0.00",
          "val2": "0.00",
          "chgp": "",
          "chgp_class": "neutral"
        },
        {
          "field": "Standalone Net Profit",
          "val1": "0.52",
          "val2": "-16.80",
          "chgp": "103.10%",
          "chgp_class": "positive"
        },
        {
          "field": "Operating Profit Margin (Excl OI)",
          "val1": "7.52%",
          "val2": "-27.05%",
          "chgp": "34.57%",
          "chgp_class": "positive"
        }
      ]
    }
  },
  {
    "link": "nine-monthly",
    "btn_text": "All Nine Monthly Results",
    "header": "Nine Monthly Results Snapshot (Standalone) - Dec'25",
    "rhs": [
      {
        "prefix": "Net Sales ",
        "suffix": "YoY Growth in nine months ended Dec 2025 is -53.19% vs 15.32% in Dec 2024",
        "dir": -1
      },
      {
        "prefix": "Standalone Net Profit ",
        "suffix": "YoY Growth in nine months ended Dec 2025 is 103.45% vs -8,600.00% in Dec 2024",
        "dir": 1
      }
    ],
    "table": {
      "header": [
        "Dec'25",
        "Dec'24",
        "Change(%)"
      ],
      "body": [
        {
          "field": "Net Sales",
          "val1": "48.72",
          "val2": "104.09",
          "chgp": "-53.19%",
          "chgp_class": "negative"
        },
        {
          "field": "Operating Profit (PBDIT) excl Other Income",
          "val1": "3.32",
          "val2": "-15.26",
          "chgp": "121.76%",
          "chgp_class": "positive"
        },
        {
          "field": "Interest",
          "val1": "1.99",
          "val2": "3.03",
          "chgp": "-34.32%",
          "chgp_class": "positive"
        },
        {
          "field": "Exceptional Items",
          "val1": "0.00",
          "val2": "0.00",
          "chgp": "",
          "chgp_class": "neutral"
        },
        {
          "field": "Standalone Net Profit",
          "val1": "0.57",
          "val2": "-16.53",
          "chgp": "103.45%",
          "chgp_class": "positive"
        },
        {
          "field": "Operating Profit Margin (Excl OI)",
          "val1": "6.81%",
          "val2": "-14.66%",
          "chgp": "21.47%",
          "chgp_class": "positive"
        }
      ]
    }
  },
  {
    "link": "annual",
    "btn_text": "All Annual Results",
    "header": "Annual Results Snapshot (Standalone) - Mar'26",
    "rhs": [
      {
        "prefix": "Net Sales ",
        "suffix": "YoY Growth in year ended Mar 2026 is -44.33% vs 18.19% in Mar 2025",
        "dir": -1
      },
      {
        "prefix": "Standalone Net Profit ",
        "suffix": "YoY Growth in year ended Mar 2026 is 103.76% vs -2,693.83% in Mar 2025",
        "dir": 1
      }
    ],
    "table": {
      "header": [
        "Mar'26",
        "Mar'25",
        "Change(%)"
      ],
      "body": [
        {
          "field": "Net Sales",
          "val1": "70.05",
          "val2": "125.82",
          "chgp": "-44.33%",
          "chgp_class": "negative"
        },
        {
          "field": "Operating Profit (PBDIT) excl Other Income",
          "val1": "4.12",
          "val2": "-19.72",
          "chgp": "120.89%",
          "chgp_class": "positive"
        },
        {
          "field": "Interest",
          "val1": "2.75",
          "val2": "3.78",
          "chgp": "-27.25%",
          "chgp_class": "positive"
        },
        {
          "field": "Exceptional Items",
          "val1": "0.00",
          "val2": "0.00",
          "chgp": "",
          "chgp_class": "neutral"
        },
        {
          "field": "Standalone Net Profit",
          "val1": "0.79",
          "val2": "-21.01",
          "chgp": "103.76%",
          "chgp_class": "positive"
        },
        {
          "field": "Operating Profit Margin (Excl OI)",
          "val1": "5.88%",
          "val2": "-15.67%",
          "chgp": "21.55%",
          "chgp_class": "positive"
        }
      ]
    }
  }
]

Quarterly Results Snapshot (Standalone) - Jun'26 - QoQstock-summary

Jun'26
Mar'26
Change(%)
Net Sales
14.97
21.32
-29.78%
Operating Profit (PBDIT) excl Other Income
-0.37
0.79
-146.84%
Interest
0.61
0.76
-19.74%
Exceptional Items
0.00
0.00
Standalone Net Profit
-1.01
0.22
-559.09%
Operating Profit Margin (Excl OI)
-2.47%
3.71%
-6.18%
Values in Rs Cr.
Direction Arrows
Net Sales

QoQ Growth in quarter ended Jun 2026 is -29.78% vs 30.08% in Mar 2026

Direction Arrows
Standalone Net Profit

QoQ Growth in quarter ended Jun 2026 is -559.09% vs 340.00% in Mar 2026

Half Yearly Results Snapshot (Standalone) - Sep'25stock-summary

Sep'25
Sep'24
Change(%)
Net Sales
32.33
61.37
-47.32%
Operating Profit (PBDIT) excl Other Income
2.43
-16.60
114.64%
Interest
1.38
2.21
-37.56%
Exceptional Items
0.00
0.00
Standalone Net Profit
0.52
-16.80
103.10%
Operating Profit Margin (Excl OI)
7.52%
-27.05%
34.57%
Values in Rs Cr.
Direction Arrows
Net Sales

Growth in half year ended Sep 2025 is -47.32% vs 21.00% in Sep 2024

Direction Arrows
Standalone Net Profit

Growth in half year ended Sep 2025 is 103.10% vs -6,322.22% in Sep 2024

Nine Monthly Results Snapshot (Standalone) - Dec'25stock-summary

Dec'25
Dec'24
Change(%)
Net Sales
48.72
104.09
-53.19%
Operating Profit (PBDIT) excl Other Income
3.32
-15.26
121.76%
Interest
1.99
3.03
-34.32%
Exceptional Items
0.00
0.00
Standalone Net Profit
0.57
-16.53
103.45%
Operating Profit Margin (Excl OI)
6.81%
-14.66%
21.47%
Values in Rs Cr.
Direction Arrows
Net Sales

YoY Growth in nine months ended Dec 2025 is -53.19% vs 15.32% in Dec 2024

Direction Arrows
Standalone Net Profit

YoY Growth in nine months ended Dec 2025 is 103.45% vs -8,600.00% in Dec 2024

Annual Results Snapshot (Standalone) - Mar'26stock-summary

Mar'26
Mar'25
Change(%)
Net Sales
70.05
125.82
-44.33%
Operating Profit (PBDIT) excl Other Income
4.12
-19.72
120.89%
Interest
2.75
3.78
-27.25%
Exceptional Items
0.00
0.00
Standalone Net Profit
0.79
-21.01
103.76%
Operating Profit Margin (Excl OI)
5.88%
-15.67%
21.55%
Values in Rs Cr.
Direction Arrows
Net Sales

YoY Growth in year ended Mar 2026 is -44.33% vs 18.19% in Mar 2025

Direction Arrows
Standalone Net Profit

YoY Growth in year ended Mar 2026 is 103.76% vs -2,693.83% in Mar 2025

stock-summaryCompany CV
About Raj Television Network Ltd stock-summary
stock-summary
Raj Television Network Ltd
Micro Cap
Media & Entertainment
Raj Television Network Limited (RTNL), widely recognized as Raj TV, continues to reinforce its stature as a premier entertainment broadcaster. The Company offers a diverse bouquet of channels, including Raj TV, Raj Music Tamil, Raj Digital Plus, Raj Music Kannada & Raj News Kannada, Raj Music Telugu & Raj News Telugu, Vissa (Telugu), Raj Pariwar (Hindi), Raj Music Malayalam & Raj News Malayalam, Raj Movies Tamil, Raj Nagaichuvai, and the upcoming Raj Kids (pipeline).
Company Coordinates stock-summary
Company Details
No 32 Poes Road IInd Street, Teynampet Chennai Tamil Nadu : 600018
stock-summary
Tel: 91-44-24351898/2926
stock-summary
administator@rajtvnet.in
Registrar Details
Cameo Corporate Services Ltd , Subramanian Buildings No 1 , Club House Road, Chennai