Ramkrishna Forg.

  • Market Cap: Small Cap
  • Industry: Auto Components & Equipments
  • ISIN: INE399G01023
  • NSEID: RKFORGE
  • BSEID: 532527
INR
617.00
37.65 (6.5%)
BSENSE

Jul 27, 12:58 PM

BSE+NSE Vol: 66.17 lacs

  • Price Points
  • Score
  • Mojo Parameters
  • Total Return
  • News and Corporate Actions
  • Key factors
  • Shareholding
  • Financials
  • CompanyCV
stock-summaryPrice Point
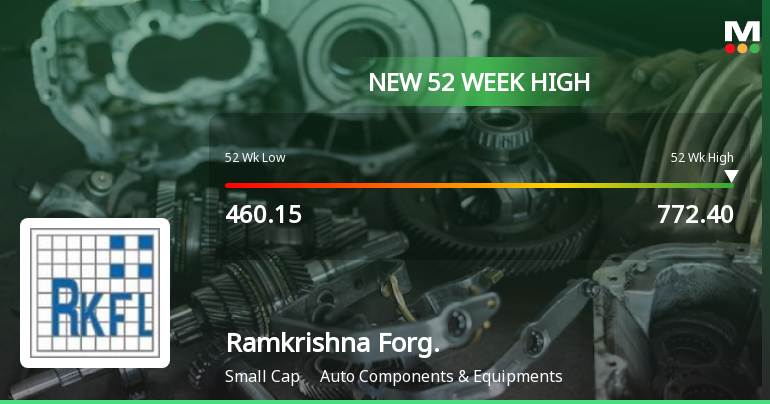
High/Low

1Day

52 Week

Valuation
Technical
Day's Volume

CASH

66.17 lacs (560.85%) Volume

Shareholding (Jun 2026)

FII

20.43%

Held by 133 FIIs

DII

5.09%

Held by 10 DIIs

Promoter

43.39%

Why is Ramkrishna Forgings Ltd falling/rising?

26-Jul-2026

As of 26-Jul, Ramkrishna Forgings Ltd's stock price is at 579.35, down 0.79%. Despite this decline, the stock has shown positive trends, outperforming the Sensex over the past week and month, and demonstrating strong long-term growth indicators.

As of 26-Jul, Ramkrishna Forgings Ltd's stock price is currently at 579.35, reflecting a decrease of 4.6 points or 0.79%. Despite this decline, the stock has shown some positive trends in recent performance. Over the past week, it has outperformed the benchmark Sensex, gaining 2.03% compared to the Sensex's drop of 2.68%. Additionally, the stock has risen by 1.41% over the past month, while the Sensex has fallen by 1.21%. Year-to-date, Ramkrishna Forgings Ltd has increased by 10.57%, contrasting with the Sensex's decline of 10.75%.<BR><BR>Today, the stock has outperformed its sector by 1.16% and has experienced consecutive gains over the last two days, with a total return of 1.65% during this period. However, it did touch an intraday low of Rs 570, indicating some volatility. The stock is also trading above its 5-day, 20-day, 50-day, 100-day, and 200-day moving averages, which is typically a positive sign.<BR><BR>On the downside, there has been a notable decrease in investor participation, with delivery volume falling by 63.88% compared to the 5-day average. This decline in trading activity may contribute to the stock's current price drop. Despite the recent fall, the company has demonstrated healthy long-term growth, with net sales increasing at an annual rate of 26.88% and strong quarterly results, including a 134.7% growth in profit after tax.<BR><BR>In summary, while Ramkrishna Forgings Ltd is currently experiencing a price decline, its recent performance metrics and long-term growth indicators suggest a complex situation where the stock has potential for recovery despite short-term volatility.

View full answer

Are Ramkrishna Forgings Ltd latest results good or bad?

25-Jul-2026

Ramkrishna Forgings Ltd's latest results show mixed performance: while operating margins improved significantly and net profit rose year-on-year, revenue stagnated and declined slightly quarter-on-quarter, raising concerns about demand. Investors should be cautious due to high valuation and the need for sustained revenue growth.

The latest results for Ramkrishna Forgings Ltd present a mixed picture. On one hand, the company achieved significant operating margin expansion, reaching 17.96%, which is the highest in recent quarters. This indicates improved operational efficiency and effective cost management. Additionally, the net profit of ₹46.88 crores reflects a remarkable year-on-year increase of 297.63%, although it did decline by 16.20% compared to the previous quarter, which had an exceptional profit due to one-time benefits.<BR><BR>However, revenue has stagnated at ₹1,216.67 crores, showing a slight decline of 0.01% quarter-on-quarter, despite a healthy year-on-year growth of 19.84%. This stagnation raises concerns about demand trends in the company's core automotive and railway segments.<BR><BR>Overall, while the margin expansion is a positive development, the lack of revenue growth and the sequential decline in profit suggest caution. The company's valuation remains high, trading at a P/E ratio of 134 times earnings, which may not be justified given the current performance metrics. Investors should monitor the situation closely to assess whether the company can sustain its margin improvements while reigniting revenue growth.

View full answer

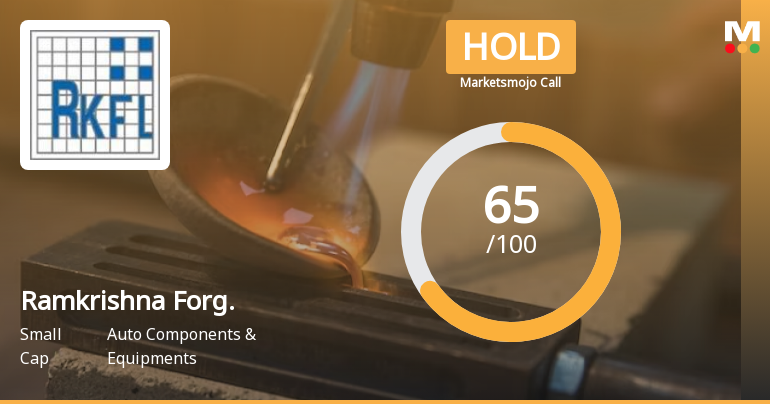
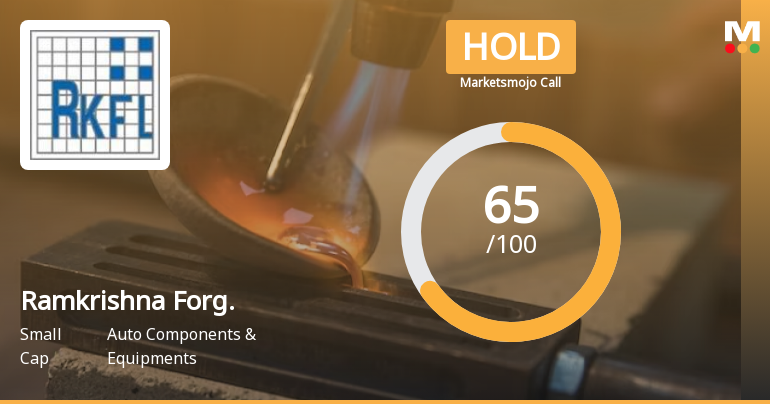
Should I buy, sell or hold Ramkrishna Forgings Ltd?

25-Jul-2026

When is the next results date for Ramkrishna Forgings Ltd?

17-Jul-2026

The next results date for Ramkrishna Forgings Ltd is July 24, 2026.

The next results date for Ramkrishna Forgings Ltd is scheduled for July 24, 2026.

View full answer

How big is Ramkrishna Forg.?

11-Jun-2026

As of 10th June, Ramkrishna Forgings Ltd has a market capitalization of 10,212.00 Cr, with recent net sales of 4,238.09 Cr and a net profit of 71.80 Cr. Shareholder's funds are 3,037.37 Cr, and total assets are valued at 6,512.50 Cr.

As of 10th June, Ramkrishna Forgings Ltd has a market capitalization of 10,212.00 Cr, categorizing it as a Small Cap company.<BR><BR>In the latest 4 quarters, the company reported Net Sales of 4,238.09 Cr and a Net Profit of 71.80 Cr.<BR><BR>For the latest annual period ending March 2025, the Shareholder's Funds amounted to 3,037.37 Cr, while the Total Assets were valued at 6,512.50 Cr.

View full answer

Who are in the management team of Ramkrishna Forg.?

11-Jun-2026

The management team of Ramkrishna Forg. includes Mahabir Prasad Jalan (Chairman), Naresh Jalan (Managing Director), Chaitanya Jalan, Pawan Kumar Kedia, and Lalit Kumar Khetan (CFO), along with several independent directors such as Padam Kumar Khaitan and Amitabha Guha. This diverse team provides strong leadership and expertise to the company.

The management team of Ramkrishna Forg. includes the following key members:<BR><BR>1. **Mahabir Prasad Jalan** - Chairman & Executive Director<BR>2. **Naresh Jalan** - Executive Director, Managing Director, and Promoter<BR>3. **Chaitanya Jalan** - Whole-Time Director & Executive Director<BR>4. **Pawan Kumar Kedia** - Executive Director & Whole-Time Director<BR>5. **Lalit Kumar Khetan** - Executive Director & Chief Financial Officer<BR><BR>Additionally, the board includes several independent directors:<BR><BR>1. **Padam Kumar Khaitan**<BR>2. **Amitabha Guha**<BR>3. **Ram Tawakya Singh**<BR>4. **Y L Madan**<BR>5. **Partha S Bhattacharyya**<BR>6. **Sandipan Chakravortty**<BR>7. **Ranaveer Sinha**<BR>8. **Rekha Shreeratan Bagry**<BR>9. **Sanjay Kothari**<BR><BR>This team brings a diverse range of expertise and leadership to the company.

View full answer

Who are the peers of the Ramkrishna Forg.?

11-Jun-2026

Ramkrishna Forg.'s peers include Shriram Pistons, Amara Raja Ener., Gabriel India, Lumax Auto Tech., Banco Products, Varroc Engineer, ASK Automotive, SJS Enterprises, and Pricol Ltd. In terms of performance, Ramkrishna Forg. has a 1-year return of -14.70%, which is better than Amara Raja Ener. but lower than its other peers.

Peers: The peers of Ramkrishna Forg. are Shriram Pistons, Amara Raja Ener., Gabriel India, Lumax Auto Tech., Banco Products, Varroc Engineer, ASK Automotive, SJS Enterprises, and Pricol Ltd.<BR><BR>Quality Snapshot: Excellent management risk is observed at Shriram Pistons, while Good management risk is found at Amara Raja Ener., Gabriel India, Lumax Auto Tech., Ramkrishna Forg., ASK Automotive, SJS Enterprises, and Pricol Ltd, and Average management risk is noted at Banco Products and Varroc Engineer. Growth is Excellent at Shriram Pistons, Gabriel India, Banco Products, and Lumax Auto Tech., while Good growth is seen at Ramkrishna Forg., Varroc Engineer, ASK Automotive, and SJS Enterprises, and Below Average growth is reported for Amara Raja Ener. Capital Structure is Excellent at Shriram Pistons, Gabriel India, Banco Products, and Pricol Ltd, Good at Lumax Auto Tech., ASK Automotive, and SJS Enterprises, and Below Average at Ramkrishna Forg. and Varroc Engineer.<BR><BR>Return Snapshot: The peer with the highest 1-year return is Gabriel India at 57.58%, while Amara Raja Ener. has the lowest at -20.83%. Ramkrishna Forg.'s 1-year return is -14.70%, which is higher than Amara Raja Ener. but lower than all other peers. Additionally, Banco Products, Varroc Engineer, ASK Automotive, and Pricol Ltd have negative six-month returns.

View full answer

What does Ramkrishna Forg. do?

10-Jun-2026

Ramkrishna Forgings Ltd manufactures and sells forged components for the automotive and railway industries. As of March 2026, it reported net sales of ₹1,217 Cr and a net profit of ₹56 Cr, with a market cap of ₹10,212 Cr.

Overview: <BR>Ramkrishna Forgings Ltd is primarily engaged in the manufacturing and sale of forged components for automobiles, railway wagons, coaches, and engineering parts, operating within the Auto Components & Equipments industry and classified as a Small Cap company.<BR><BR>History: <BR>Ramkrishna Forgings Limited was incorporated on November 12, 1981, as a Private Limited Company and was converted into a Public Limited Company on May 25, 1995. The latest quarterly results reported net sales and net profit for the period ending March 2026.<BR><BR>Financial Snapshot: <BR>Net Sales: 1,217 Cr (Quarterly Results - Mar 2026) <BR>Net Profit: 56 Cr (Quarterly Results - Mar 2026) <BR>Market Cap: INR 10,212 Cr (Small Cap)<BR><BR>Key Metrics: <BR>P/E: 126.00 <BR>Industry P/E: 46 <BR>Dividend Yield: 0.18% <BR>Debt-Equity: 0.69 <BR>Return on Equity: 2.43% <BR>Price to Book: 3.00<BR><BR>Contact Details: <BR>Address: 23 Circus Avenue, Kolkata, West Bengal: 700017 <BR>Tel: 91-33-39840900 <BR>Email: neha.gupta@ramkrishnaforgings.com <BR>Website: http://www.ramkrishnaforgings.com

View full answer

Is Ramkrishna Forg. technically bullish or bearish?

05-Dec-2025

As of December 4, 2025, the market trend is mildly bearish due to daily moving averages and weekly Bollinger Bands indicating bearish momentum, despite mixed signals from the MACD and RSI across different time frames.

As of 4 December 2025, the technical trend has changed from bearish to mildly bearish. The current stance is mildly bearish, driven primarily by the daily moving averages indicating bearish momentum and the weekly Bollinger Bands also showing a bearish signal. The MACD on a weekly basis is mildly bullish, but the monthly MACD remains bearish, suggesting mixed signals across time frames. The RSI shows no signal on the weekly chart while being bullish on the monthly, indicating potential divergence. Overall, the lack of a clear trend in Dow Theory and the absence of strong signals from OBV further support a cautious outlook.

View full answer

Is Ramkrishna Forg. overvalued or undervalued?

18-Nov-2025

As of November 17, 2025, Ramkrishna Forg. is overvalued with a PE ratio of 44.92 and a concerning long-term outlook, having declined 38.75% year-to-date, making it not a compelling investment despite recent short-term gains.

As of 17 November 2025, Ramkrishna Forg. has moved from a fair to an expensive valuation grade. The company is currently overvalued, with a PE ratio of 44.92, an EV to EBIT of 67.70, and a Price to Book Value of 3.27. In comparison to peers, Bharat Forge has a PE of 61.18 and an EV to EBITDA of 26.21, while CIE Automotive, which is rated attractive, shows a significantly lower PE of 20.38 and an EV to EBITDA of 12.10.<BR><BR>Despite recent stock performance showing a 3.58% return over the past week compared to the Sensex's 1.69%, the long-term outlook is concerning, with a year-to-date decline of 38.75% against the Sensex's 8.72% gain. This indicates that while there may be short-term fluctuations, the overall valuation suggests that Ramkrishna Forg. is not a compelling investment at its current price.

View full answer

How has been the historical performance of Ramkrishna Forg.?

17-Nov-2025

Ramkrishna Forg. has experienced significant growth in net sales, rising from 1,216.47 crore in March 2020 to 4,034.11 crore in March 2025, although profit before tax declined to 148.80 crore in March 2025. The company faces challenges in profitability and cash flow despite robust revenue growth and increased total assets.

Answer:<BR>The historical performance of Ramkrishna Forg. shows significant growth in net sales and profit over the years, with a notable increase in the latest fiscal year.<BR><BR>Breakdown:<BR>Ramkrishna Forg. has demonstrated a consistent upward trend in net sales, rising from 1,216.47 crore in March 2020 to 4,034.11 crore in March 2025. This growth is accompanied by an increase in total operating income, which reached 4,034.11 crore in March 2025, up from 1,216.47 crore in March 2020. The company's operating profit (PBDIT) has also seen fluctuations, peaking at 585.95 crore in March 2025, although it was higher at 800.97 crore in March 2024. Profit before tax showed a decline to 148.80 crore in March 2025 from 397.53 crore in March 2024, while profit after tax increased to 332.66 crore in March 2025, up from 282.88 crore in March 2024. The total assets of the company have expanded significantly, reaching 6,512.50 crore in March 2025, compared to 2,228.48 crore in March 2020, indicating robust growth in the company's financial position. However, total debt has also increased to 2,012.77 crore in March 2025 from 880.80 crore in March 2020, reflecting a rise in leverage. Cash flow from operating activities has decreased to 32.00 crore in March 2025 from 621.00 crore in March 2024, contributing to a net cash outflow of 157.00 crore in March 2025. Overall, while Ramkrishna Forg. has shown impressive revenue growth, it faces challenges in maintaining profitability and managing cash flow.

View full answer

Who are the top shareholders of the Ramkrishna Forg.?

17-Jul-2025

The top shareholders of Ramkrishna Forg. include Riddhi Portfolio Private Limited as the largest promoter with 33.45%, foreign institutional investors holding 24.47%, and Smallcap World Fund, Inc. as the highest public shareholder at 7.78%. Overall, promoters and institutional investors dominate the ownership structure.

The top shareholders of Ramkrishna Forg. include a mix of promoters, institutional investors, and individual shareholders. The majority of the shares are held by promoters, with Riddhi Portfolio Private Limited being the largest promoter, holding 33.45% of the shares. <BR><BR>In terms of institutional investment, foreign institutional investors (FIIs) hold 24.47% of the company, while mutual funds collectively own 2.45% through 18 different schemes. The highest public shareholder is Smallcap World Fund, Inc, which holds 7.78%. Additionally, individual investors account for 17.71% of the total shareholding. <BR><BR>Overall, the ownership structure reflects a strong presence of both promoter and institutional investors.

View full answer

Has Ramkrishna Forg. declared dividend?

06-Jun-2025

Yes, Ramkrishna Forgings Ltd has declared a 50% dividend, with an ex-date of June 6, 2025. While recent total returns have been negative over shorter periods, the company has shown significant growth over the longer term, particularly a total return of 1679.87% over the past 5 years.

Ramkrishna Forgings Ltd has declared a 50% dividend.<BR><BR>Dividend Details:<BR>- Percentage announced: 50%<BR>- Ex-date: 06 Jun 25<BR><BR>Dividend Yield: 0%<BR><BR>Total Returns by Period:<BR>In the last 6 months, the price return was -31.91%, with a dividend return of 0%, resulting in a total return of -31.91%.<BR><BR>Over the past year, the price return was -5.55%, with a dividend return of 0%, leading to a total return of -5.55%.<BR><BR>In the 2-year period, the price return was 74.87%, the dividend return was 0.46%, and the total return was 75.33%.<BR><BR>For the 3-year period, the price return was 299.58%, the dividend return was 2.81%, culminating in a total return of 302.39%.<BR><BR>In the last 4 years, the price return was 390.18%, the dividend return was 4.40%, resulting in a total return of 394.58%.<BR><BR>Over the past 5 years, the price return was 1661.83%, with a dividend return of 18.04%, leading to a total return of 1679.87%.<BR><BR>Overall, while Ramkrishna Forgings Ltd has declared a dividend, the recent total returns over shorter periods have been negative, indicating potential volatility. However, the longer-term returns show significant growth, particularly over the 5-year period.

View full answer
iScoreScore
Click here to find our call on this stock
Strong Sell
Sell
Hold
Buy
Strong Buy

Dashboard

1

Healthy long term growth as Net Sales has grown by an annual rate of 26.88%

 
2

Positive results in Jun 26

3

With ROCE of 5.6, it has a Expensive valuation with a 2.3 Enterprise value to Capital Employed

4

High Institutional Holdings at 25.52%

stock-summaryMojo Parameters

Mojo Parameters

Loading Valuation Snapshot...

Stock DNA

stock-summary
Industry

Auto Components & Equipments

stock-summary
Market cap

INR 11,240 Cr (Small Cap)

stock-summary
P/E

134.00

stock-summary
Industry P/E

50

stock-summary
Dividend Yield

0.17%

stock-summary
Debt Equity

0.69

stock-summary
Return on Equity

2.43%

stock-summary
Price to Book

3.24

Revenue and Profits:
Net Sales:
1,217 Cr
(Quarterly Results - Jun 2026)
Net Profit:
47 Cr
stock-summaryTotal Returns
Total Returns (Price + Dividend) stock-summary
Dividend Yield (0.17%)
TimePeriod
Price Return
Dividend Return
Total Return
3 Months
9.52%
0.17%
9.69%
6 Months
23.85%
0.20%
24.05%
1 Year
-1.38%
0.18%
-1.2%
2 Years
-26.86%
0.23%
-26.63%
3 Years
9.47%
0.68%
10.15%
4 Years
247.7%
3.03%
250.73%
5 Years
274.53%
3.69%
278.22%

Latest dividend: 1 per share ex-dividend date: May-08-2026

Risk Adjusted Returns v/s stock-summary
Returns Beta
Icon
Beta has not been calculated since enough price history is not available
stock-summaryNews & Corporate Actions

News

Announcements stock-summary

Announcement under Regulation 30 (LODR)-Analyst / Investor Meet - Outcome

25-Jul-2026 | Source : BSE

Please find attached audio link for Q1 FY27 Earnings Conference Call

Announcement under Regulation 30 (LODR)-Newspaper Publication

25-Jul-2026 | Source : BSE

We hereby enclose the copies of Extract of Statement of the Un-audited (Standalone & Consolidated) Financial Results of the Company for the Quarter ended 30th June 2026 published in Business Standard(English Newspaper-All Edition) and AajKaal(Bengali Regional Newspaper-Kolkata edition) on Saturday25th July 2026

Appointment Of Internal Auditors For The FY 2026-27

24-Jul-2026 | Source : BSE

Appointment of M/s. Singhi & Co. Chartered Accountants as an Internal Auditors of the Company for the FY 2026-27

Corporate Actions stock-summary

stock-summary
BOARD MEETING

No Upcoming Board Meetings

stock-summary
DIVIDEND

Ramkrishna Forgings Ltd has declared 50% dividend, ex-date: 08 May 26

stock-summary
SPLITS

Ramkrishna Forgings Ltd has announced 2:10 stock split, ex-date: 14 Mar 22

stock-summary
BONUS

No Bonus history available

stock-summary
RIGHTS

No Rights history available

stock-summaryKey Factors

Quality key factors stock-summary

Factor
Value
Sales Growth (5y)
26.88%
EBIT Growth (5y)
23.93%
EBIT to Interest (avg)
2.93
Debt to EBITDA (avg)
2.94
Net Debt to Equity (avg)
0.69
Sales to Capital Employed (avg)
0.92
Tax Ratio
14.54%
Dividend Payout Ratio
8.72%
Pledged Shares
15.56%
Institutional Holding
25.52%
ROCE (avg)
11.77%
ROE (avg)
12.49%

Valuation key factors

Factor
Value
P/E Ratio
134
Industry P/E
50
Price to Book Value
3.24
EV to EBIT
41.79
EV to EBITDA
20.15
EV to Capital Employed
2.32
EV to Sales
3.06
PEG Ratio
NA
Dividend Yield
0.17%
ROCE (Latest)
5.56%
ROE (Latest)
2.43%

Technicals key factors

Indicator
Weekly
Monthly
MACD
Bullish
Bearish
RSI
No Signal
No Signal
Bollinger Bands
Bullish
Mildly Bearish
Moving Averages
Bullish (Daily)
KST
Mildly Bearish
Bearish
Dow Theory
No Trend
No Trend
OBV
No Trend
Bullish
stock-summary Technical Indicator Scale: Bearish, Mildly Bearish, Sideways, Mildly Bullish, Bullish  Turned 
stock-summaryShareholding
Shareholding Snapshot : Jun 2026stock-summary
Shareholding Compare (%holding) stock-summary
Majority shareholders

Promoters

Pledged Promoter Holdings

15.5608

Mutual Funds

Held by 18 Schemes (1.91%)

FIIs

Held by 133 FIIs (20.43%)

Promoter with highest holding

Riddhi Portfolio Private Limited (34.74%)

Highest Public shareholder

Smallcap World Fund, Inc (5.96%)

Individual Investors Holdings

19.94%

stock-summaryFinancial
[
  {
    "link": "quarterly",
    "btn_text": "All Quarterly Results",
    "header": "Quarterly Results Snapshot (Consolidated) - Jun'26 - QoQ",
    "rhs": [
      {
        "prefix": "Net Sales ",
        "suffix": "QoQ Growth in quarter ended Jun 2026 is -0.01% vs 10.77% in Mar 2026",
        "dir": -1
      },
      {
        "prefix": "Consolidated Net Profit ",
        "suffix": "QoQ Growth in quarter ended Jun 2026 is -16.20% vs 312.23% in Mar 2026",
        "dir": -1
      }
    ],
    "table": {
      "header": [
        "Jun'26",
        "Mar'26",
        "Change(%)"
      ],
      "body": [
        {
          "field": "Net Sales",
          "val1": "1,216.67",
          "val2": "1,216.78",
          "chgp": "-0.01%",
          "chgp_class": "negative"
        },
        {
          "field": "Operating Profit (PBDIT) excl Other Income",
          "val1": "218.47",
          "val2": "208.19",
          "chgp": "4.94%",
          "chgp_class": "positive"
        },
        {
          "field": "Interest",
          "val1": "57.13",
          "val2": "57.32",
          "chgp": "-0.33%",
          "chgp_class": "positive"
        },
        {
          "field": "Exceptional Items",
          "val1": "0.00",
          "val2": "-0.28",
          "chgp": "100.00%",
          "chgp_class": "positive"
        },
        {
          "field": "Consolidate Net Profit",
          "val1": "46.88",
          "val2": "55.94",
          "chgp": "-16.20%",
          "chgp_class": "negative"
        },
        {
          "field": "Operating Profit Margin (Excl OI)",
          "val1": "17.96%",
          "val2": "17.11%",
          "chgp": "0.85%",
          "chgp_class": "positive"
        }
      ]
    }
  },
  {
    "link": "half-yearly",
    "btn_text": "All Half Yearly Results",
    "header": "Half Yearly Results Snapshot (Consolidated) - Sep'25",
    "rhs": [
      {
        "prefix": "Net Sales ",
        "suffix": " Growth in half year ended Sep 2025 is -4.49% vs 16.03% in Sep 2024",
        "dir": -1
      },
      {
        "prefix": "Consolidated Net Profit ",
        "suffix": " Growth in half year ended Sep 2025 is -98.82% vs 20.91% in Sep 2024",
        "dir": -1
      }
    ],
    "table": {
      "header": [
        "Sep'25",
        "Sep'24",
        "Change(%)"
      ],
      "body": [
        {
          "field": "Net Sales",
          "val1": "1,922.79",
          "val2": "2,013.11",
          "chgp": "-4.49%",
          "chgp_class": "negative"
        },
        {
          "field": "Operating Profit (PBDIT) excl Other Income",
          "val1": "271.15",
          "val2": "334.77",
          "chgp": "-19.00%",
          "chgp_class": "negative"
        },
        {
          "field": "Interest",
          "val1": "101.93",
          "val2": "75.04",
          "chgp": "35.83%",
          "chgp_class": "negative"
        },
        {
          "field": "Exceptional Items",
          "val1": "0.00",
          "val2": "83.47",
          "chgp": "-100.00%",
          "chgp_class": "negative"
        },
        {
          "field": "Consolidate Net Profit",
          "val1": "2.29",
          "val2": "194.33",
          "chgp": "-98.82%",
          "chgp_class": "negative"
        },
        {
          "field": "Operating Profit Margin (Excl OI)",
          "val1": "14.10%",
          "val2": "16.63%",
          "chgp": "-2.53%",
          "chgp_class": "negative"
        }
      ]
    }
  },
  {
    "link": "nine-monthly",
    "btn_text": "All Nine Monthly Results",
    "header": "Nine Monthly Results Snapshot (Consolidated) - Dec'25",
    "rhs": [
      {
        "prefix": "Net Sales ",
        "suffix": "YoY Growth in nine months ended Dec 2025 is -2.12% vs 13.05% in Dec 2024",
        "dir": -1
      },
      {
        "prefix": "Consolidated Net Profit ",
        "suffix": "YoY Growth in nine months ended Dec 2025 is -92.63% vs -13.07% in Dec 2024",
        "dir": -1
      }
    ],
    "table": {
      "header": [
        "Dec'25",
        "Dec'24",
        "Change(%)"
      ],
      "body": [
        {
          "field": "Net Sales",
          "val1": "3,021.31",
          "val2": "3,086.89",
          "chgp": "-2.12%",
          "chgp_class": "negative"
        },
        {
          "field": "Operating Profit (PBDIT) excl Other Income",
          "val1": "434.52",
          "val2": "461.10",
          "chgp": "-5.76%",
          "chgp_class": "negative"
        },
        {
          "field": "Interest",
          "val1": "153.03",
          "val2": "117.22",
          "chgp": "30.55%",
          "chgp_class": "negative"
        },
        {
          "field": "Exceptional Items",
          "val1": "-10.43",
          "val2": "83.47",
          "chgp": "-112.50%",
          "chgp_class": "negative"
        },
        {
          "field": "Consolidate Net Profit",
          "val1": "15.86",
          "val2": "215.23",
          "chgp": "-92.63%",
          "chgp_class": "negative"
        },
        {
          "field": "Operating Profit Margin (Excl OI)",
          "val1": "14.38%",
          "val2": "14.94%",
          "chgp": "-0.56%",
          "chgp_class": "negative"
        }
      ]
    }
  },
  {
    "link": "annual",
    "btn_text": "All Annual Results",
    "header": "Annual Results Snapshot (Consolidated) - Mar'26",
    "rhs": [
      {
        "prefix": "Net Sales ",
        "suffix": "YoY Growth in year ended Mar 2026 is 5.06% vs 8.90% in Mar 2025",
        "dir": -1
      },
      {
        "prefix": "Consolidated Net Profit ",
        "suffix": "YoY Growth in year ended Mar 2026 is -82.70% vs 42.52% in Mar 2025",
        "dir": -1
      }
    ],
    "table": {
      "header": [
        "Mar'26",
        "Mar'25",
        "Change(%)"
      ],
      "body": [
        {
          "field": "Net Sales",
          "val1": "4,238.08",
          "val2": "4,034.11",
          "chgp": "5.06%",
          "chgp_class": "positive"
        },
        {
          "field": "Operating Profit (PBDIT) excl Other Income",
          "val1": "642.71",
          "val2": "559.56",
          "chgp": "14.86%",
          "chgp_class": "positive"
        },
        {
          "field": "Interest",
          "val1": "210.35",
          "val2": "165.86",
          "chgp": "26.82%",
          "chgp_class": "negative"
        },
        {
          "field": "Exceptional Items",
          "val1": "-10.72",
          "val2": "83.47",
          "chgp": "-112.84%",
          "chgp_class": "negative"
        },
        {
          "field": "Consolidate Net Profit",
          "val1": "71.81",
          "val2": "415.03",
          "chgp": "-82.70%",
          "chgp_class": "negative"
        },
        {
          "field": "Operating Profit Margin (Excl OI)",
          "val1": "15.17%",
          "val2": "13.87%",
          "chgp": "1.30%",
          "chgp_class": "positive"
        }
      ]
    }
  }
]

Quarterly Results Snapshot (Consolidated) - Jun'26 - QoQstock-summary

Jun'26
Mar'26
Change(%)
Net Sales
1,216.67
1,216.78
-0.01%
Operating Profit (PBDIT) excl Other Income
218.47
208.19
4.94%
Interest
57.13
57.32
-0.33%
Exceptional Items
0.00
-0.28
100.00%
Consolidate Net Profit
46.88
55.94
-16.20%
Operating Profit Margin (Excl OI)
17.96%
17.11%
0.85%
Values in Rs Cr.
Direction Arrows
Net Sales

QoQ Growth in quarter ended Jun 2026 is -0.01% vs 10.77% in Mar 2026

Direction Arrows
Consolidated Net Profit

QoQ Growth in quarter ended Jun 2026 is -16.20% vs 312.23% in Mar 2026

Half Yearly Results Snapshot (Consolidated) - Sep'25stock-summary

Sep'25
Sep'24
Change(%)
Net Sales
1,922.79
2,013.11
-4.49%
Operating Profit (PBDIT) excl Other Income
271.15
334.77
-19.00%
Interest
101.93
75.04
35.83%
Exceptional Items
0.00
83.47
-100.00%
Consolidate Net Profit
2.29
194.33
-98.82%
Operating Profit Margin (Excl OI)
14.10%
16.63%
-2.53%
Values in Rs Cr.
Direction Arrows
Net Sales

Growth in half year ended Sep 2025 is -4.49% vs 16.03% in Sep 2024

Direction Arrows
Consolidated Net Profit

Growth in half year ended Sep 2025 is -98.82% vs 20.91% in Sep 2024

Nine Monthly Results Snapshot (Consolidated) - Dec'25stock-summary

Dec'25
Dec'24
Change(%)
Net Sales
3,021.31
3,086.89
-2.12%
Operating Profit (PBDIT) excl Other Income
434.52
461.10
-5.76%
Interest
153.03
117.22
30.55%
Exceptional Items
-10.43
83.47
-112.50%
Consolidate Net Profit
15.86
215.23
-92.63%
Operating Profit Margin (Excl OI)
14.38%
14.94%
-0.56%
Values in Rs Cr.
Direction Arrows
Net Sales

YoY Growth in nine months ended Dec 2025 is -2.12% vs 13.05% in Dec 2024

Direction Arrows
Consolidated Net Profit

YoY Growth in nine months ended Dec 2025 is -92.63% vs -13.07% in Dec 2024

Annual Results Snapshot (Consolidated) - Mar'26stock-summary

Mar'26
Mar'25
Change(%)
Net Sales
4,238.08
4,034.11
5.06%
Operating Profit (PBDIT) excl Other Income
642.71
559.56
14.86%
Interest
210.35
165.86
26.82%
Exceptional Items
-10.72
83.47
-112.84%
Consolidate Net Profit
71.81
415.03
-82.70%
Operating Profit Margin (Excl OI)
15.17%
13.87%
1.30%
Values in Rs Cr.
Direction Arrows
Net Sales

YoY Growth in year ended Mar 2026 is 5.06% vs 8.90% in Mar 2025

Direction Arrows
Consolidated Net Profit

YoY Growth in year ended Mar 2026 is -82.70% vs 42.52% in Mar 2025

stock-summaryCompany CV
About Ramkrishna Forgings Ltd stock-summary
stock-summary
Ramkrishna Forgings Ltd
Small Cap
Auto Components & Equipments
Ramkrishna Forgings Limited was incorporated on November 12, 1981 as a Private Limited Company with the name 'Ramkrishna Forgings Private Limited'. On May 25, 1995, the Company was converted into a Public Limited Company and the name was changed to Ramkrishna Forgings Limited. The Company is primarily engaged in manufacturing and sale of forged components of automobiles, railway wagons & coach and engineering parts.
Company Coordinates stock-summary
Company Details
23 Circus Avenue , Kolkata West Bengal : 700017
stock-summary
Tel: 91-33-39840900
stock-summary
neha.gupta@ramkrishnaforgings.com
Registrar Details
Karvy Computershare Pvt Ltd, Plot No 17-24 , Near Image Hospital,, Reliance Cybervilae,Vithalrao Nagar,, Madhapur, Hyderabad