
Compare Rana Sugars with Similar Stocks
Dashboard
Weak Long Term Fundamental Strength with a -51.17% CAGR growth in Operating Profits over the last 5 years
- Low ability to service debt as the company has a high Debt to EBITDA ratio of 7.89 times
- The company has been able to generate a Return on Equity (avg) of 9.54% signifying low profitability per unit of shareholders funds
Negative results in Mar 26
Consistent Underperformance against the benchmark over the last 3 years
Total Returns (Price + Dividend) 
Rana Sugars for the last several years.
Risk Adjusted Returns v/s
Returns Beta

News
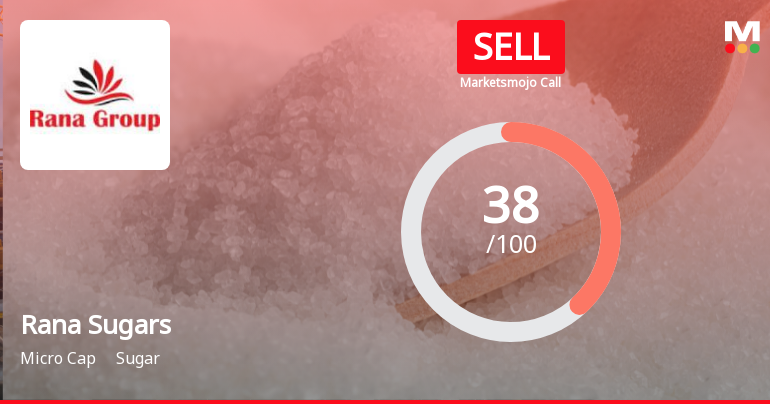
Rana Sugars Ltd Upgraded to Sell on Technical Improvement Despite Weak Fundamentals
Rana Sugars Ltd has seen its investment rating upgraded from Strong Sell to Sell as of 10 June 2026, driven primarily by a shift in technical indicators. Despite persistent fundamental challenges, including weak financial trends and low profitability, the stock’s technical outlook has improved to mildly bullish, prompting a reassessment of its market stance.
Read full news article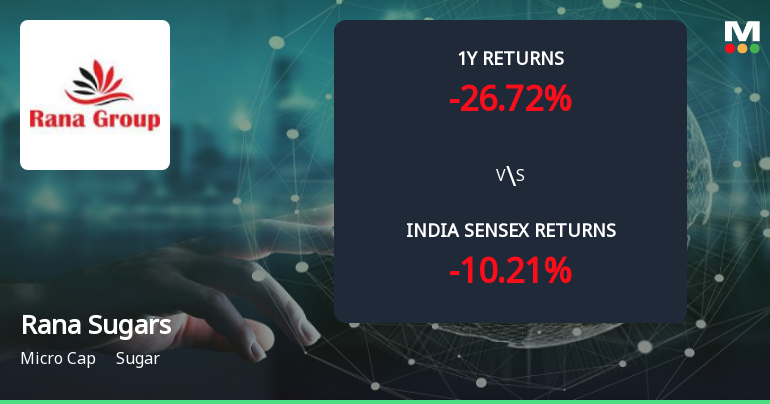
Golden Cross Forms in Rana Sugars Ltd — On a Day the Stock Fell 1.48%. What the Mixed Signals Mean
The 50-day moving average has crossed above the 200-day moving average for Rana Sugars Ltd, signalling a golden cross on 10 Jun 2026. Yet, the stock declined 1.48% on the day this technical event occurred, while monthly indicators remain only mildly bullish or even bearish. This juxtaposition of signals calls for a detailed examination of the cross’s reliability in the context of broader technical and fundamental data.
Read full news article
Rana Sugars Ltd is Rated Strong Sell
Rana Sugars Ltd is rated Strong Sell by MarketsMOJO, with this rating last updated on 18 May 2026. However, the analysis and financial metrics discussed here reflect the stock's current position as of 31 May 2026, providing investors with the latest insights into the company’s performance and outlook.
Read full news article Announcements
Announcement under Regulation 30 (LODR)-Newspaper Publication
30-May-2026 | Source : BSEPublication of Audited Financial Results for the quarter and year ended 31.03.2026
Audited Financial Results For The Quarter And Year Ended On 31St March 2026
29-May-2026 | Source : BSEAs per letter attached
Board Meeting Outcome for Integrated Filing Financial
29-May-2026 | Source : BSETo consider and approve the Audited Financial Results of the Company for the Quarter and Year ended March 31 2026.
Corporate Actions

No Upcoming Board Meetings

No Dividend history available

No Splits history available

No Bonus history available

No Rights history available
Quality key factors
Valuation key factors
Technicals key factors
 Technical Indicator Scale: Bearish, Mildly Bearish, Sideways, Mildly Bullish, Bullish Turned
 Shareholding Snapshot : Mar 2026
Shareholding Compare (%holding)
Non Institution
None
Held by 1 Schemes (0.0%)
Held by 1 FIIs (0.11%)
Manminder Rana (11.68%)
Punjab Energy Development Agency (1.66%)
68.96%
Quarterly Results Snapshot (Standalone) - Mar'26 - YoY

YoY Growth in quarter ended Mar 2026 is -7.79% vs 14.31% in Mar 2025
YoY Growth in quarter ended Mar 2026 is -30.28% vs 83.41% in Mar 2025
Half Yearly Results Snapshot (Standalone) - Sep'25

Growth in half year ended Sep 2025 is 3.38% vs 0.90% in Sep 2024
Growth in half year ended Sep 2025 is -29.35% vs -1,772.73% in Sep 2024
Nine Monthly Results Snapshot (Standalone) - Dec'25
YoY Growth in nine months ended Dec 2025 is 5.46% vs 5.16% in Dec 2024
YoY Growth in nine months ended Dec 2025 is -398.48% vs -78.95% in Dec 2024
Annual Results Snapshot (Standalone) - Mar'26
YoY Growth in year ended Mar 2026 is 1.79% vs 7.54% in Mar 2025
YoY Growth in year ended Mar 2026 is -30.74% vs 22.92% in Mar 2025
About Rana Sugars Ltd

Company Coordinates


