
Compare Raymond with Similar Stocks
Dashboard
Weak Long Term Fundamental Strength with a -8.49% CAGR growth in Net Sales over the last 5 years
- The company has been able to generate a Return on Capital Employed (avg) of 8.89% signifying low profitability per unit of total capital (equity and debt)
Flat results in Mar 26
Falling Participation by Institutional Investors
Total Returns (Price + Dividend) 
Latest dividend: 10 per share ex-dividend date: Jun-13-2024
Risk Adjusted Returns v/s
Returns Beta

News

Raymond Ltd Technical Momentum Shifts Amid Mixed Market Signals
Raymond Ltd, a small-cap player in the realty sector, has recently exhibited a notable shift in its technical momentum, moving from a mildly bearish to a mildly bullish trend. Despite a modest day gain of 0.43%, the stock’s technical indicators present a complex picture, with weekly signals generally positive while monthly indicators remain cautious. This nuanced technical landscape, combined with the company’s mixed returns relative to the Sensex, offers investors a detailed framework to assess Raymond’s near-term prospects.
Read full news article
Raymond Ltd is Rated Sell
Raymond Ltd is rated 'Sell' by MarketsMOJO, with this rating last updated on 16 Feb 2026. However, the analysis and financial metrics discussed here reflect the company’s current position as of 09 June 2026, providing investors with an up-to-date view of its fundamentals, valuation, financial trends, and technical outlook.
Read full news article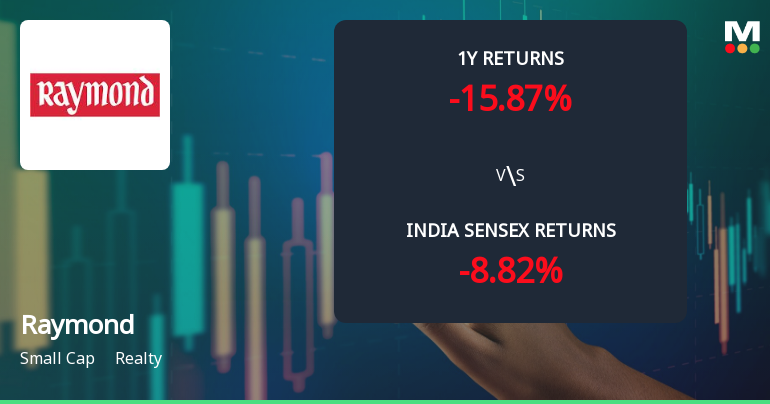
Raymond Ltd Technical Momentum Shifts Amid Mixed Market Signals
Raymond Ltd, a small-cap player in the Realty sector, has experienced a notable shift in its technical momentum, moving from a mildly bullish to a mildly bearish stance. Despite a strong year-to-date return of 24.11%, the stock’s recent price action and technical indicators suggest a complex outlook, with mixed signals from key momentum and trend-following tools.
Read full news article Announcements
Announcement under Regulation 30 (LODR)-Newspaper Publication
11-Jun-2026 | Source : BSEPlease find enclosed intimation under Regulation 30 of SEBI Listing Regulations
Corrigendum To The Notice Of Extraordinary General Meeting (EGM) Dated May 25 2026
10-Jun-2026 | Source : BSEPlease find enclosed intimation under Regulation 30 of SEBI Listing Regulations 2015
Announcement Under Regulation 30 (LODR)-Analyst / Investor Meet
05-Jun-2026 | Source : BSEPlease find enclosed intimation under Regulation 30 of SEBI Listing Regulations
Corporate Actions

No Upcoming Board Meetings

Raymond Ltd has declared 100% dividend, ex-date: 13 Jun 24

No Splits history available

No Bonus history available

No Rights history available
Quality key factors
Valuation key factors
Technicals key factors
 Technical Indicator Scale: Bearish, Mildly Bearish, Sideways, Mildly Bullish, Bullish Turned
 Shareholding Snapshot : Mar 2026
Shareholding Compare (%holding)
Promoters
15.2531
Held by 7 Schemes (1.86%)
Held by 85 FIIs (9.75%)
J K Investors (bombay) Limited (29.83%)
Nippon Life India Trustee Ltd-a/c Nippon India Small Cap Fund (1.86%)
32.42%
Quarterly Results Snapshot (Consolidated) - Mar'26 - YoY

YoY Growth in quarter ended Mar 2026 is 8.15% vs -40.90% in Mar 2025

YoY Growth in quarter ended Mar 2026 is -99.15% vs -42.08% in Mar 2025
Half Yearly Results Snapshot (Consolidated) - Sep'25
Growth in half year ended Sep 2025 is 13.93% vs -2.13% in Sep 2024
Growth in half year ended Sep 2025 is -28.14% vs 506.22% in Sep 2024
Nine Monthly Results Snapshot (Consolidated) - Dec'25
YoY Growth in nine months ended Dec 2025 is 15.81% vs -14.33% in Dec 2024
YoY Growth in nine months ended Dec 2025 is -28.78% vs 432.37% in Dec 2024
Annual Results Snapshot (Consolidated) - Mar'26
YoY Growth in year ended Mar 2026 is 13.63% vs -24.11% in Mar 2025
YoY Growth in year ended Mar 2026 is -30.01% vs 365.97% in Mar 2025
About Raymond Ltd

Company Coordinates


