
Compare Reliable Data with Similar Stocks
Dashboard
Negative results in Mar 26
- PAT(Latest six months) At Rs 4.51 cr has Grown at -43.58%
- PBDIT(Q) Lowest at Rs 2.73 cr.
- OPERATING PROFIT TO NET SALES (Q) Lowest at 4.96%
With ROCE of 19, it has a Very Attractive valuation with a 2.1 Enterprise value to Capital Employed
Majority shareholders : Promoters
Market Beating Performance
Stock DNA
Non Banking Financial Company (NBFC)
INR 145 Cr (Micro Cap)
17.00
21
0.00%
0.23
13.38%
2.29
Total Returns (Price + Dividend) 
Latest dividend: 0 per share ex-dividend date: Sep-12-2025
Risk Adjusted Returns v/s
Returns Beta

News

Reliable Data Services Ltd is Rated Hold
Reliable Data Services Ltd is rated 'Hold' by MarketsMOJO, with this rating last updated on 07 July 2026. While the rating change occurred on that date, the analysis and financial metrics discussed here reflect the stock's current position as of 30 July 2026, providing investors with an up-to-date view of the company’s fundamentals, valuation, financial trends, and technical outlook.
Read full news article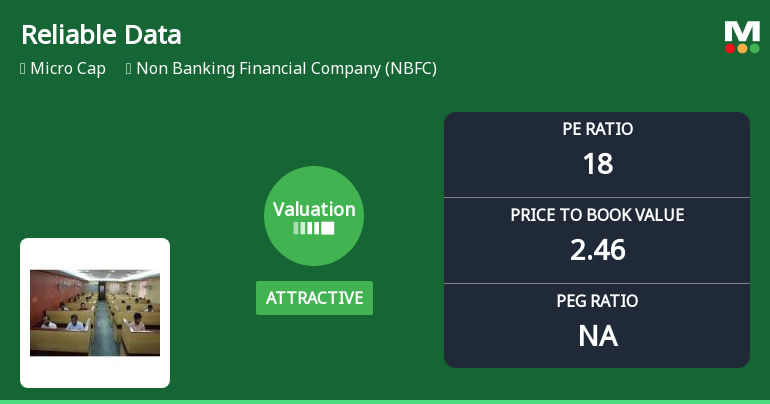
Reliable Data Services Ltd: Valuation Shift Enhances Price Attractiveness Amid NBFC Sector Dynamics
Reliable Data Services Ltd has witnessed a notable improvement in its valuation parameters, shifting from a very attractive to an attractive rating. This change reflects a more favourable price-to-earnings (P/E) and price-to-book value (P/BV) positioning relative to its historical averages and peer group, signalling a potential recalibration of investor sentiment within the Non Banking Financial Company (NBFC) sector.
Read full news article
Reliable Data Services Ltd is Rated Hold
Reliable Data Services Ltd is rated 'Hold' by MarketsMOJO, with this rating last updated on 07 July 2026. However, the analysis and financial metrics presented here reflect the stock's current position as of 19 July 2026, providing investors with an up-to-date view of its performance and prospects.
Read full news article Announcements
Compliances-Certificate under Reg. 74 (5) of SEBI (DP) Regulations 2018
06-Jul-2026 | Source : BSEcertificate under sebi regulation for the quarter ended as on 30.06.2026.
Closure of Trading Window
26-Jun-2026 | Source : BSEclosure of trading window from 1.07.2026 for declaration of unaudited financial results.
Board Comments On Fine Levied By Exchange
03-Jun-2026 | Source : BSEBoard comments
Corporate Actions

No Upcoming Board Meetings


No Splits history available

No Bonus history available

No Rights history available
Quality key factors
Valuation key factors
Technicals key factors
 Technical Indicator Scale: Bearish, Mildly Bearish, Sideways, Mildly Bullish, Bullish Turned
 Shareholding Snapshot : Jun 2026
Shareholding Compare (%holding)
Promoters
None
Held by 0 Schemes
Held by 1 FIIs (0.33%)
Sanjay Kumar Pathak (15.35%)
Hemendra Ratilal Mehta (4.32%)
24.46%
Quarterly Results Snapshot (Consolidated) - Mar'26 - YoY

YoY Growth in quarter ended Mar 2026 is 3.81% vs 90.55% in Mar 2025
YoY Growth in quarter ended Mar 2026 is -66.93% vs 146.50% in Mar 2025
Half Yearly Results Snapshot (Consolidated) - Sep'25

Growth in half year ended Sep 2025 is 145.82% vs 42.35% in Sep 2024
Growth in half year ended Sep 2025 is 53.12% vs 15.32% in Sep 2024
Nine Monthly Results Snapshot (Consolidated) - Dec'25
YoY Growth in nine months ended Dec 2025 is 70.20% vs 50.47% in Dec 2024
YoY Growth in nine months ended Dec 2025 is 5.84% vs 126.44% in Dec 2024
Annual Results Snapshot (Consolidated) - Mar'26
YoY Growth in year ended Mar 2026 is 41.73% vs 64.51% in Mar 2025
YoY Growth in year ended Mar 2026 is -23.73% vs 99.56% in Mar 2025
About Reliable Data Services Ltd

Company Coordinates


