
Compare Reliable Data with Similar Stocks
Dashboard
Negative results in Mar 26
- PAT(Latest six months) At Rs 4.51 cr has Grown at -43.58%
- PBDIT(Q) Lowest at Rs 2.73 cr.
- OPERATING PROFIT TO NET SALES (Q) Lowest at 4.96%
With ROCE of 19, it has a Very Attractive valuation with a 2.1 Enterprise value to Capital Employed
Majority shareholders : Promoters
Market Beating Performance
Stock DNA
Non Banking Financial Company (NBFC)
INR 149 Cr (Micro Cap)
18.00
20
0.00%
0.23
13.38%
2.35
Total Returns (Price + Dividend) 
Latest dividend: 0 per share ex-dividend date: Sep-12-2025
Risk Adjusted Returns v/s
Returns Beta

News

Reliable Data Services Ltd is Rated Sell
Reliable Data Services Ltd is rated 'Sell' by MarketsMOJO, with this rating last updated on 30 April 2026. However, the analysis and financial metrics discussed below reflect the stock's current position as of 04 June 2026, providing investors with an up-to-date view of the company’s fundamentals, returns, and market standing.
Read full news article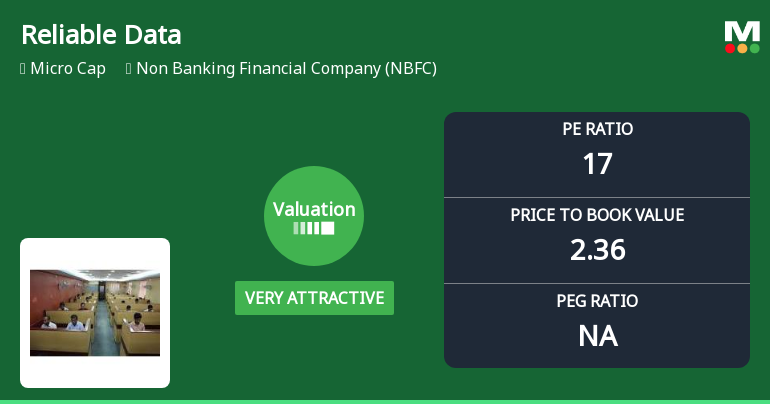
Reliable Data Services Ltd Valuation Shifts to Very Attractive Amid Strong Market Performance
Reliable Data Services Ltd, a micro-cap player in the Non Banking Financial Company (NBFC) sector, has seen a notable shift in its valuation parameters, moving from an attractive to a very attractive rating. This change comes amid a backdrop of strong relative returns and improved price multiples compared to both its historical averages and peer group, signalling a potential opportunity for discerning investors despite a recent downgrade in its overall Mojo Grade to Sell.
Read full news articleAre Reliable Data Services Ltd latest results good or bad?
The latest financial results for Reliable Data Services Ltd reveal a complex operational landscape characterized by significant challenges. For the quarter ending March 2026, the company reported net sales of ₹55.03 crores, reflecting a modest year-on-year growth of 3.81%, a stark contrast to the much higher growth of 90.55% in the same quarter of the previous year. This indicates a marked slowdown in revenue growth. However, the company's profitability has faced severe pressures, with net profit plummeting to ₹1.28 crores, a decline of 66.93% compared to ₹3.87 crores in the prior year. This sharp drop underscores the operational difficulties the company is encountering, particularly as the operating profit margin fell to 4.96%, the lowest level in recent quarters, down from 6.40% a year prior. The significant increase in employee costs, which surged dramatically to consume nearly 92% of total revenue, has...
Read full news article Announcements
Board Comments On Fine Levied By Exchange
03-Jun-2026 | Source : BSEBoard comments
Announcement under Regulation 30 (LODR)-Newspaper Publication
01-Jun-2026 | Source : BSEdisclosure for newspaper publication in Pioneer for Financial results for the quarter ended 31.03.2026.
Approved Financial Results For The Quarter Ended On 30/05/2026
30-May-2026 | Source : BSEApproved financial results
Corporate Actions

No Upcoming Board Meetings


No Splits history available

No Bonus history available

No Rights history available
Quality key factors
Valuation key factors
Technicals key factors
 Technical Indicator Scale: Bearish, Mildly Bearish, Sideways, Mildly Bullish, Bullish Turned
 Shareholding Snapshot : Mar 2026
Shareholding Compare (%holding)
Promoters
None
Held by 0 Schemes
Held by 1 FIIs (0.45%)
Sanjay Kumar Pathak (15.35%)
Hemendra Ratilal Mehta (4.34%)
26.56%
Quarterly Results Snapshot (Consolidated) - Mar'26 - YoY

YoY Growth in quarter ended Mar 2026 is 3.81% vs 90.55% in Mar 2025
YoY Growth in quarter ended Mar 2026 is -66.93% vs 146.50% in Mar 2025
Half Yearly Results Snapshot (Consolidated) - Sep'25

Growth in half year ended Sep 2025 is 145.82% vs 42.35% in Sep 2024
Growth in half year ended Sep 2025 is 53.12% vs 15.32% in Sep 2024
Nine Monthly Results Snapshot (Consolidated) - Dec'25
YoY Growth in nine months ended Dec 2025 is 70.20% vs 50.47% in Dec 2024
YoY Growth in nine months ended Dec 2025 is 5.84% vs 126.44% in Dec 2024
Annual Results Snapshot (Consolidated) - Mar'26
YoY Growth in year ended Mar 2026 is 41.73% vs 64.51% in Mar 2025
YoY Growth in year ended Mar 2026 is -23.73% vs 99.56% in Mar 2025
About Reliable Data Services Ltd

Company Coordinates


