
Compare Responsive Ind with Similar Stocks
Dashboard
Poor long term growth as Net Sales has grown by an annual rate of 13.03% over the last 5 years
The company has declared Negative results for the last 3 consecutive quarters
With ROCE of 9.8, it has a Expensive valuation with a 3 Enterprise value to Capital Employed
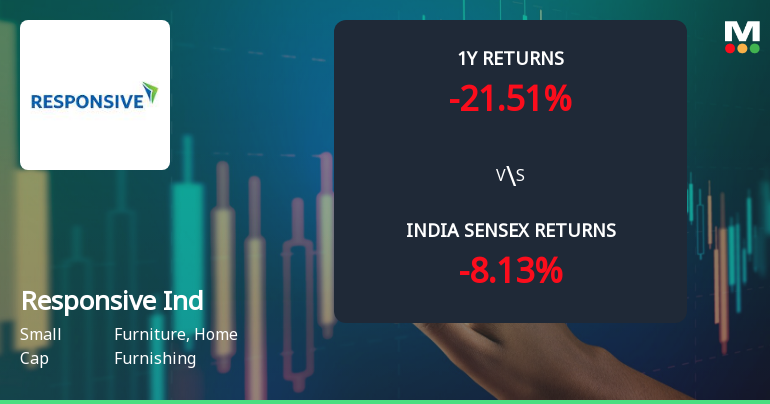
Underperformed the market in the last 1 year
Stock DNA
Furniture, Home Furnishing
INR 5,084 Cr (Small Cap)
34.00
223
0.05%
0.11
9.55%
3.25
Total Returns (Price + Dividend) 
Latest dividend: 0.1 per share ex-dividend date: Sep-12-2025
Risk Adjusted Returns v/s
Returns Beta

News
Responsive Industries Ltd Technical Momentum Shifts Amid Market Volatility
Responsive Industries Ltd has experienced a notable shift in its technical momentum, moving from a mildly bullish stance to a sideways trend, reflecting a complex interplay of technical indicators. Despite a recent sharp decline of 6.62% in daily price, the stock’s mixed signals across MACD, RSI, moving averages, and other momentum indicators suggest a cautious outlook for investors navigating the furniture and home furnishing sector.
Read full news article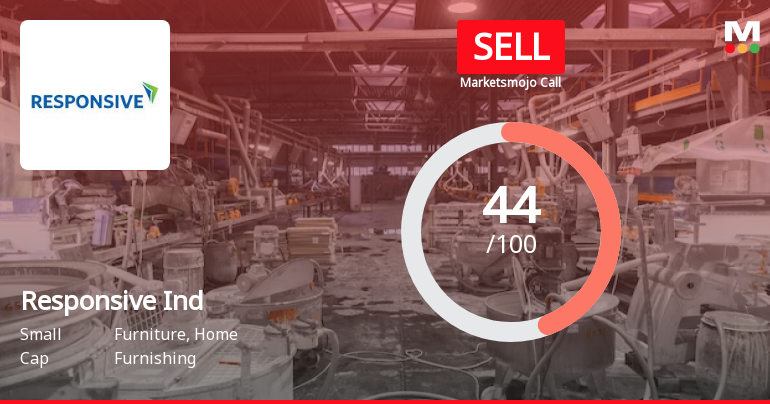
Responsive Industries Ltd is Rated Sell
Responsive Industries Ltd is rated Sell by MarketsMOJO, with this rating last updated on 16 June 2026. However, the analysis and financial metrics discussed here reflect the stock's current position as of 09 July 2026, providing investors with an up-to-date view of the company’s fundamentals, returns, and market performance.
Read full news article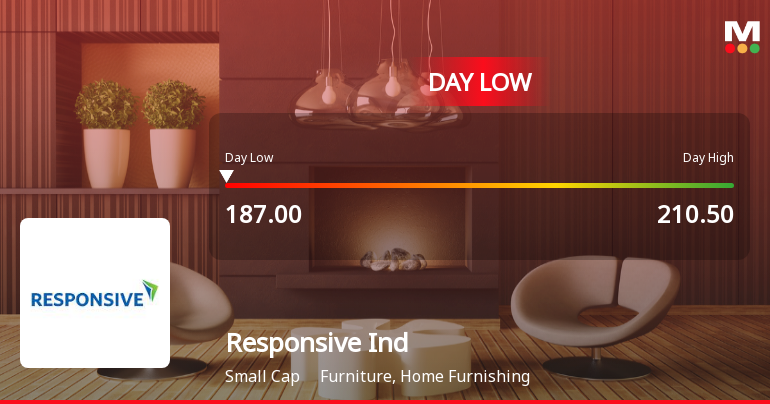
Responsive Industries Ltd Hits Intraday Low Amid Price Pressure on 9 July 2026
Responsive Industries Ltd experienced notable intraday weakness on 09 Jul 2026, with the stock touching a low of Rs 191.95, reflecting a decline of 5.84% from its previous close. This downturn contributed to an overall day loss of 8.24%, underperforming its sector and broader market indices amid prevailing price pressures and subdued market sentiment.
Read full news article Announcements
Responsive Industries Limited - Address Change
14-Nov-2019 | Source : NSEResponsive Industries Limited has informed the Exchange regarding change in Corporate Office of the company.
Responsive Industries Limited - Updates
13-Nov-2019 | Source : NSEResponsive Industries Limited has informed the Exchange regarding 'Pursuant to Regulations 30 and 47 of the SEBI (Listing Obligations and Disclosure Requirements) Regulations, 2015, please find enclosed herewith a copy of the newspapers wherein the Unaudited Financial Results of the Company for the quarter and half year ended September 30, 2019, are published. '.
Responsive Industries Limited - Financial Results Updates
08-Nov-2019 | Source : NSEResponsive Industries Limited has informed the Exchange that Due to typo error in the submitted financial results and statement of assets and liabilities, further the Company has submitted a copy of revised financial results.
Corporate Actions

No Upcoming Board Meetings

Responsive Industries Ltd has declared 10% dividend, ex-date: 12 Sep 25

Responsive Industries Ltd has announced 1:10 stock split, ex-date: 08 Oct 10

Responsive Industries Ltd has announced 3:1 bonus issue, ex-date: 22 Mar 07

No Rights history available
Quality key factors
Valuation key factors
Technicals key factors
 Technical Indicator Scale: Bearish, Mildly Bearish, Sideways, Mildly Bullish, Bullish Turned
 Shareholding Snapshot : Mar 2026
Shareholding Compare (%holding)
Promoters
5.6466
Held by 1 Schemes (0.0%)
Held by 34 FIIs (32.2%)
Wellknown Business Ventures Llp (47.51%)
Fossebridge Limited (12.32%)
3.67%
Quarterly Results Snapshot (Consolidated) - Mar'26 - QoQ

QoQ Growth in quarter ended Mar 2026 is 38.23% vs -0.77% in Dec 2025
QoQ Growth in quarter ended Mar 2026 is 1.51% vs -57.79% in Dec 2025
Half Yearly Results Snapshot (Consolidated) - Sep'25

Growth in half year ended Sep 2025 is -2.53% vs 25.95% in Sep 2024
Growth in half year ended Sep 2025 is 5.60% vs 40.11% in Sep 2024
Nine Monthly Results Snapshot (Consolidated) - Dec'25
YoY Growth in nine months ended Dec 2025 is -7.08% vs 29.85% in Dec 2024
YoY Growth in nine months ended Dec 2025 is -13.14% vs 26.40% in Dec 2024
Annual Results Snapshot (Consolidated) - Mar'26
YoY Growth in year ended Mar 2026 is -1.68% vs 30.45% in Mar 2025
YoY Growth in year ended Mar 2026 is -25.36% vs 23.31% in Mar 2025
About Responsive Industries Ltd

Company Coordinates


