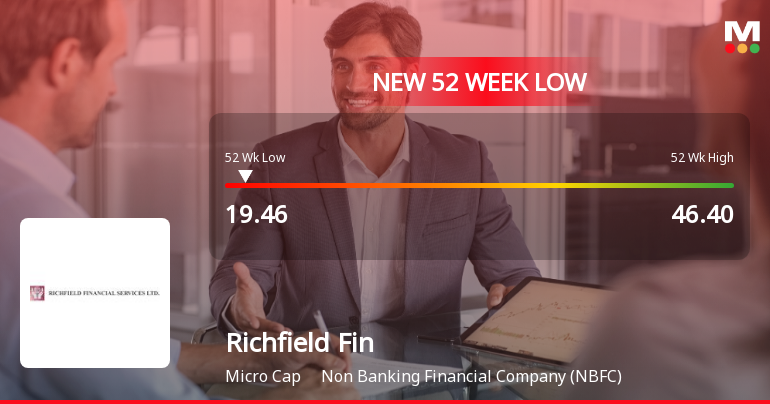
Richfield Fin

  • Market Cap: Micro Cap
  • Industry: Non Banking Financial Company (NBFC)
  • ISIN: INE201C01012
  • NSEID:
  • BSEID: 539435
INR
19.46
-1.02 (-4.98%)
BSENSE

Aug 28, 01:34 PM

BSE+NSE Vol: 2.76 k

  • Price Points
  • Score
  • Mojo Parameters
  • Total Return
  • News and Corporate Actions
  • Key factors
  • Shareholding
  • Financials
  • CompanyCV
stock-summaryPrice Point
High/Low

1Day

52 Week

Valuation
Technical
Day's Volume

CASH

2.76 k (52.62%) Volume

Shareholding (Jun 2026)

FII

0.00%

Held by 0 FIIs

DII

0.00%

Held by 0 DIIs

Promoter

37.13%

Why is Richfield Financial Services Ltd falling/rising?

28-Aug-2026

As of 27-Aug, Richfield Financial Services Ltd's stock price is currently at Rs 20.48, reflecting a 4.17% increase today, driven by heightened investor interest. However, the stock has significantly underperformed over the year, with declines of 43.61% year-to-date and 45.96% over the past year.

As of 27-Aug, Richfield Financial Services Ltd's stock price is rising, currently at Rs 20.48, which reflects an increase of Rs 0.82 or 4.17%. This rise is notable as the stock has outperformed its sector by 4.88% today. Additionally, there has been a significant increase in investor participation, with delivery volume rising by 348.94% compared to the 5-day average, indicating heightened interest in the stock.<BR><BR>Despite the positive movement today, it is important to note that the stock has been underperforming over longer periods, with a year-to-date decline of 43.61% and a one-year decline of 45.96%. Furthermore, the stock is currently trading below all its moving averages, which suggests a longer-term bearish trend. However, the immediate rise in price can be attributed to today's performance and increased trading activity.

View full answer

Should I buy, sell or hold Richfield Financial Services Ltd?

19-Aug-2026

Who are in the management team of Richfield Fin?

14-Aug-2026

The management team of Richfield Fin includes Vadasseril Chacko Georgekutty (Managing Director), Midhun Ittoop (Non Executive Director), Neethu Subramoniyan (Independent Director), Varghese Mathew (Non Executive Director), and Indu Ravindran (Independent Director).

The management team of Richfield Fin includes the following individuals:<BR><BR>1. Vadasseril Chacko Georgekutty - Managing Director<BR>2. Midhun Ittoop - Non Executive Director<BR>3. Neethu Subramoniyan - Independent Director<BR>4. Varghese Mathew - Non Executive Director<BR>5. Indu Ravindran - Independent Director<BR><BR>If you have any more questions about Richfield Fin or its operations, feel free to ask!

View full answer

What does Richfield Fin do?

14-Aug-2026

Richfield Financial Services Ltd is a Non Banking Financial Company (NBFC) focused on the micro-cap market, with a recent quarterly net sales of 5 Cr and a market cap of INR 21 Cr. The company was established in 1992 and has undergone several name changes, currently reporting a P/E of 40.00 and a debt-equity ratio of 4.72.

Overview:<BR>Richfield Financial Services Ltd operates as a Non Banking Financial Company (NBFC) within the micro-cap market segment.<BR><BR>History:<BR>The company was initially incorporated in 1992 as Richfield Portfolio Management Private Limited and transitioned to a public limited company in 1994, changing its name to Richfield Financial Services Limited in 1995. The latest quarterly results reported net sales and net profit for June 2026.<BR><BR>Financial Snapshot:<BR>- Net Sales: 5 Cr (Quarterly Results - Jun 2026)<BR>- Net Profit: 0 Cr (Quarterly Results - Jun 2026)<BR>- Market-cap: INR 21 Cr (Micro Cap)<BR><BR>Key Metrics:<BR>- P/E: 40.00<BR>- Industry P/E: 21<BR>- Dividend Yield: 0.00%<BR>- Debt Equity: 4.72<BR>- Return on Equity: 2.54%<BR>- Price to Book: 1.64<BR><BR>Contact Details:<BR>Address: 33 Brabourne Road, 5th Floor Kolkata West Bengal : 700001<BR>Tel: 91-33-2242-5812<BR>Email: rfsl.nbfc@gmail.com<BR>Website: http://www.rfsl.co.in

View full answer

Who are the peers of the Richfield Fin?

14-Aug-2026

Richfield Fin's peers include Vani Commercials, Standard Battery, Bervin Invest., Shricon Indus., Navigant Corp., West Leisure, Jindal Capital, Mansi Fin.(Chen), and KJMC Corporate. Richfield Fin has below-average management risk and growth, with a 1-year return of -27.55%, slightly better than Vani Commercials' -27.85%.

Peers: The peers of Richfield Fin are Vani Commercials, Standard Battery, Bervin Invest., Shricon Indus., Navigant Corp., West Leisure, Jindal Capital, Mansi Fin.(Chen), KJMC Corporate.<BR><BR>Quality Snapshot: Excellent management risk is observed at Navigant Corp. and the rest. Average management risk is found at Bervin Invest., Shricon Indus., and the rest. Below Average management risk is noted for Vani Commercials, Jindal Capital, Mansi Fin.(Chen), KJMC Corporate, and Richfield Fin. Growth is rated as Excellent for Richfield Fin., while Good growth is seen at Vani Commercials, Bervin Invest., Shricon Indus., KJMC Corporate, and the rest. Below Average growth is observed at Jindal Capital, Mansi Fin.(Chen), and the rest. Capital Structure is Excellent for Vani Commercials, Bervin Invest., Shricon Indus., Navigant Corp., Jindal Capital, Mansi Fin.(Chen), KJMC Corporate, and Richfield Fin.<BR><BR>Return Snapshot: The peer with the highest 1-year return is Bervin Invest. at 0%, while the peer with the lowest is Vani Commercials at -27.85%. Richfield Fin's 1-year return is -27.55%, which is slightly better than Vani Commercials. Additionally, several peers, including Standard Battery, Jindal Capital, Mansi Fin.(Chen), KJMC Corporate, and Richfield Fin, have negative six-month returns.

View full answer

How big is Richfield Fin?

14-Aug-2026

As of 14th August, Richfield Financial Services Ltd has a market capitalization of 24.00 Cr, with recent Net Sales of 14.91 Cr and a Net Profit of 0.61 Cr. The latest balance sheet from March 2017 shows Shareholder's Funds of 5.97 Cr and Total Assets of 5.98 Cr.

As of 14th August, Richfield Financial Services Ltd has a market capitalization of 24.00 Cr, categorizing it as a Micro Cap company.<BR><BR>In the latest four quarters, the company reported Net Sales of 14.91 Cr and a Net Profit of 0.61 Cr.<BR><BR>The latest annual period for the balance sheet is March 2017, showing Shareholder's Funds of 5.97 Cr and Total Assets of 5.98 Cr.

View full answer

When is the next results date for Richfield Financial Services Ltd?

05-Aug-2026

The next results date for Richfield Financial Services Ltd is 12 August 2026.

The next results date for Richfield Financial Services Ltd is scheduled for 12 August 2026.

View full answer

Are Richfield Financial Services Ltd latest results good or bad?

28-May-2026

Richfield Financial Services Ltd's latest results are concerning, showing a net loss of ₹0.16 crores in Q4 FY26 despite a 150% year-on-year revenue growth to ₹4.30 crores, primarily due to a 45.53% increase in interest costs and declining operating margins. The high debt-to-equity ratio further raises financial risk, indicating challenges to the sustainability of its business model.

Richfield Financial Services Ltd's latest results indicate significant challenges. In Q4 FY26, the company reported a net loss of ₹0.16 crores, a stark contrast to the profit of ₹0.09 crores in the previous quarter (Q3). This marks a concerning shift in profitability, especially given the impressive revenue growth of 150% year-on-year, which brought net sales to ₹4.30 crores.<BR><BR>However, this revenue growth was overshadowed by a substantial increase in interest costs, which surged by 45.53% quarter-on-quarter to ₹1.79 crores. This rise in financing costs has severely impacted the company's operating profit, leading to a profit before tax of ₹-0.18 crores. Additionally, the operating margin declined from 36.33% in Q3 to 29.30% in Q4, indicating deteriorating operational efficiency.<BR><BR>The company has also faced challenges related to its capital structure, with a high debt-to-equity ratio of 4.97, which amplifies financial risk, particularly in a rising interest rate environment. Overall, while Richfield Financial Services has demonstrated strong revenue growth, the combination of losses, rising costs, and declining margins suggests that the latest results are more negative than positive, raising concerns about the sustainability of its business model.

View full answer

How has been the historical performance of Richfield Fin?

18-Nov-2025

Richfield Fin showed positive financial growth from March 2016 to March 2017, with net sales increasing to 0.72 Cr, profit after tax rising to 0.23 Cr, and a significant improvement in earnings per share to 0.61. The company also achieved positive cash flow from operating activities of 1.97 Cr, indicating a strengthening financial position.

Answer:<BR>The historical performance of Richfield Fin shows a positive trend in key financial metrics from March 2016 to March 2017.<BR><BR>Breakdown:<BR>In the fiscal year ending March 2017, Richfield Fin reported net sales of 0.72 Cr, an increase from 0.55 Cr in the previous year. Total operating income also rose to 0.72 Cr from 0.55 Cr, while total expenditure increased to 0.70 Cr from 0.49 Cr. The operating profit (PBDIT) excluding other income improved to 0.02 Cr from 0.06 Cr, and with other income included, the operating profit reached 0.24 Cr, up from 0.06 Cr. Profit before tax saw a significant increase to 0.24 Cr from 0.05 Cr, leading to a profit after tax of 0.23 Cr compared to 0.04 Cr in the prior year. The earnings per share (EPS) rose to 0.61 from 0.1, and the profit after tax margin improved to 31.48% from 6.72%. On the balance sheet, total assets increased to 5.98 Cr from 5.78 Cr, while total liabilities rose slightly to 5.98 Cr from 5.78 Cr. The cash flow from operating activities turned positive at 1.97 Cr, compared to a negative cash flow of -0.03 Cr in the previous year, although cash flow from investing activities was negative at -2.07 Cr. Overall, Richfield Fin demonstrated growth in sales, profits, and cash flow, indicating a strengthening financial position.

View full answer

Who are the top shareholders of the Richfield Fin?

17-Jul-2025

The top shareholders of Richfield Fin are V C Georgekutty with 15.84%, Anilkumar with 6.97%, and individual investors who collectively own 35.88%. There are no institutional holdings or pledged promoter shares.

The top shareholders of Richfield Fin include V C Georgekutty, who holds the highest promoter stake at 15.84%. The highest public shareholder is Anilkumar, with a holding of 6.97%. Additionally, individual investors collectively own 35.88% of the company. There are no institutional holdings or pledged promoter shares reported.

View full answer

Is Richfield Fin overvalued or undervalued?

09-Jun-2025

As of October 3, 2024, Richfield Fin is considered very expensive and overvalued with a PE Ratio of 30.14, a Price to Book Value of 3.58, and an EV to EBIT of -51.13, especially when compared to peers like Life Insurance at 12.54 and Bajaj Finance at 35.01, alongside a recent stock decline of 6.33% against the Sensex's gain of 1.36%.

As of 3 October 2024, the valuation grade for Richfield Fin has moved from expensive to very expensive, indicating a significant shift in its market perception. The company is currently considered overvalued. Key financial ratios reveal a PE Ratio of 30.14, a Price to Book Value of 3.58, and a troubling EV to EBIT of -51.13, which suggests that the company is not generating positive earnings relative to its enterprise value.<BR><BR>In comparison to its peers, Richfield Fin's valuation stands out unfavorably; for instance, Life Insurance has a PE Ratio of 12.54 and Bajaj Finance Ltd. is at 35.01, both indicating more attractive valuations. Additionally, the company's recent stock performance shows a decline of 6.33% over the past week, contrasting with the Sensex's gain of 1.36%, further emphasizing its overvaluation in the current market context.

View full answer

What is the technical trend for Richfield Fin?

09-Jun-2025

As of June 2, 2025, Richfield Fin's technical trend is mildly bearish, influenced by daily moving averages and a mixed outlook from MACD and Bollinger Bands across different timeframes.

As of 2 June 2025, the technical trend for Richfield Fin has changed from sideways to mildly bearish. The weekly MACD is bullish, but the monthly MACD is mildly bearish, indicating mixed signals. The daily moving averages are mildly bearish, supporting the overall bearish stance. The Bollinger Bands show a bearish signal on the weekly timeframe while being mildly bullish on the monthly, adding to the complexity of the trend. The KST is bearish weekly but bullish monthly, and Dow Theory indicates a mildly bullish weekly trend with no clear monthly direction. Overall, the current technical stance is mildly bearish, driven primarily by the daily moving averages and the monthly MACD.

View full answer

What is the bonus history of the Richfield Fin?

06-Jun-2025

Richfield Financial Services Ltd has announced a 1:1 bonus issue effective February 14, 2025, meaning shareholders will receive an additional share for each share held. The record and ex-date for this bonus is also February 14, 2025.

Richfield Financial Services Ltd has a recent bonus history that includes a 1:1 bonus issue, which is set to take effect on February 14, 2025. This means that for every share held, shareholders will receive an additional share. The record date and ex-date for this bonus are both the same, February 14, 2025. If you have any more questions about the company or its financial activities, feel free to ask!

View full answer

Has Richfield Fin declared dividend?

06-Jun-2025

Richfield Financial Services Ltd has declared an 8% dividend, amounting to $0.80 per share, with an ex-date of June 7, 2024. The company has shown strong total returns over various periods, particularly with significant price appreciation in the long term.

Richfield Financial Services Ltd has declared an 8% dividend.<BR><BR>Dividend Details:<BR>- Percentage announced: 8%<BR>- Amount per share: 0.80<BR>- Ex-date: Jun-07-2024<BR><BR>Dividend Yield: 0.98%<BR><BR>Total Returns by Period:<BR>In the 6-month period, the price return was 36.19%, with a dividend return of 0%, resulting in a total return of 36.19%.<BR><BR>For the 1-year period, the price return was 5.35%, with a dividend return of 0%, leading to a total return of 5.35%.<BR><BR>Over the 2-year period, the price return was 778.47%, with a dividend return of 16.67%, culminating in a total return of 795.14%.<BR><BR>In the 3-year period, the price return was 867.27%, with a dividend return of 19.23%, resulting in a total return of 886.5%.<BR><BR>For the 4-year period, the price return was 1016.39%, with a dividend return of 22.22%, leading to a total return of 1038.61%.<BR><BR>Over the 5-year period, the price return was 986.22%, with a dividend return of 22.22%, culminating in a total return of 1008.44%.<BR><BR>Overall, Richfield Financial Services Ltd has declared a dividend, and the total returns over various periods indicate strong performance, particularly in the longer terms, highlighting significant price appreciation alongside the dividend returns.

View full answer
iScoreScore
Click here to find our call on this stock
Strong Sell
Sell
Hold
Buy
Strong Buy

Dashboard

1

Weak Long Term Fundamental Strength with an average Return on Equity (ROE) of 3.00%

 
2

Below par performance in long term as well as near term

stock-summaryMojo Parameters

Mojo Parameters

Loading Valuation Snapshot...

Stock DNA

stock-summary
Industry

Non Banking Financial Company (NBFC)

stock-summary
Market cap

INR 19 Cr (Micro Cap)

stock-summary
P/E

32.00

stock-summary
Industry P/E

NA

stock-summary
Dividend Yield

0.00%

stock-summary
Debt Equity

4.72

stock-summary
Return on Equity

4.31%

stock-summary
Price to Book

1.40

Revenue and Profits:
Net Sales:
5 Cr
(Quarterly Results - Jun 2026)
Net Profit:
0 Cr
stock-summaryTotal Returns
Total Returns (Price + Dividend) stock-summary
Dividend Yield (0%)
TimePeriod
Price Return
Dividend Return
Total Return
3 Months
-25.89%
0%
-25.89%
6 Months
-35.39%
0%
-35.39%
1 Year
-46.09%
0%
-46.09%
2 Years
-32.55%
0%
-32.55%
3 Years
0%
0%
0.0%
4 Years
0%
0%
0.0%
5 Years
0%
0%
0.0%

Latest dividend: 0.4 per share ex-dividend date: Jun-07-2024

Risk Adjusted Returns v/s stock-summary
Returns Beta
Icon
Beta has not been calculated since enough price history is not available
stock-summaryNews & Corporate Actions

News

Richfield Financial Services Ltd Falls 8.35%: Valuation Reset and Technical Signals Shape Week

Announcements stock-summary

Announcement Under Regulation 30_Outcome Of Finance Committee

24-Aug-2026 | Source : BSE

Outcome of Finance Committee

Announcement under Regulation 30 (LODR)-Newspaper Publication

13-Aug-2026 | Source : BSE

Announcement under regulation 30 (LODR)-Newspaper Publication of the Unaudited financial Results of the Company for the quarter ended June 30 2026.

Board Meeting Outcome for Outcome Of The Board Meeting August 12 2026

12-Aug-2026 | Source : BSE

The Board in its meeting held today approved quarterly financial results for the quarter ended June 30 2026 and Notice of AGM and Annual report for the year ended March 31 2026.

Corporate Actions stock-summary

stock-summary
BOARD MEETING

No Upcoming Board Meetings

stock-summary
DIVIDEND

Richfield Financial Services Ltd has declared 8% dividend, ex-date: 07 Jun 24

stock-summary
SPLITS

No Splits history available

stock-summary
BONUS

Richfield Financial Services Ltd has announced 1:1 bonus issue, ex-date: 14 Feb 25

stock-summary
RIGHTS

No Rights history available

stock-summaryKey Factors

Quality key factors stock-summary

Factor
Value
Sales Growth (5y)
71.76%
EBIT Growth (5y)
49.23%
Net Debt to Equity (avg)
4.72
Institutional Holding
0
ROE (avg)
3.00%

Valuation key factors

Factor
Value
P/E Ratio
32
Industry P/E
0
Price to Book Value
1.40
EV to EBIT
14.17
EV to EBITDA
13.91
EV to Capital Employed
1.07
EV to Sales
5.61
PEG Ratio
0.20
Dividend Yield
NA
ROCE (Latest)
5.63%
ROE (Latest)
4.31%

Technicals key factors

Indicator
Weekly
Monthly
MACD
Mildly Bullish
Bearish
RSI
No Signal
No Signal
Bollinger Bands
Bearish
Bearish
Moving Averages
Bearish (Daily)
KST
Bearish
Mildly Bearish
Dow Theory
Mildly Bearish
Mildly Bullish
stock-summary Technical Indicator Scale: Bearish, Mildly Bearish, Sideways, Mildly Bullish, Bullish  Turned 
stock-summaryShareholding
Shareholding Snapshot : Jun 2026stock-summary
Shareholding Compare (%holding) stock-summary
Majority shareholders

Non Institution

Pledged Promoter Holdings

None

Mutual Funds

Held by 0 Schemes

FIIs

Held by 0 FIIs

Promoter with highest holding

V C Georgekutty (12.53%)

Highest Public shareholder

Ente Naadu Multi State Agro Cooperative Society Limited (8.28%)

Individual Investors Holdings

41.67%

stock-summaryFinancial
[
  {
    "link": "quarterly",
    "btn_text": "All Quarterly Results",
    "header": "Quarterly Results Snapshot (Standalone) - Jun'26 - YoY",
    "rhs": [
      {
        "prefix": "Net Sales ",
        "suffix": "YoY Growth in quarter ended Jun 2026 is 123.74% vs 195.95% in Jun 2025",
        "dir": -1
      },
      {
        "prefix": "Standalone Net Profit ",
        "suffix": "YoY Growth in quarter ended Jun 2026 is 277.78% vs 80.00% in Jun 2025",
        "dir": 1
      }
    ],
    "table": {
      "header": [
        "Jun'26",
        "Jun'25",
        "Change(%)"
      ],
      "body": [
        {
          "field": "Net Sales",
          "val1": "4.90",
          "val2": "2.19",
          "chgp": "123.74%",
          "chgp_class": "positive"
        },
        {
          "field": "Operating Profit (PBDIT) excl Other Income",
          "val1": "2.41",
          "val2": "0.90",
          "chgp": "167.78%",
          "chgp_class": "positive"
        },
        {
          "field": "Interest",
          "val1": "1.96",
          "val2": "0.81",
          "chgp": "141.98%",
          "chgp_class": "negative"
        },
        {
          "field": "Exceptional Items",
          "val1": "0.00",
          "val2": "0.00",
          "chgp": "",
          "chgp_class": "neutral"
        },
        {
          "field": "Standalone Net Profit",
          "val1": "0.34",
          "val2": "0.09",
          "chgp": "277.78%",
          "chgp_class": "positive"
        },
        {
          "field": "Operating Profit Margin (Excl OI)",
          "val1": "49.18%",
          "val2": "41.10%",
          "chgp": "8.08%",
          "chgp_class": "positive"
        }
      ]
    }
  },
  {
    "link": "half-yearly",
    "btn_text": "All Half Yearly Results",
    "header": "Half Yearly Results Snapshot (Standalone) - Sep'25",
    "rhs": [
      {
        "prefix": "Net Sales ",
        "suffix": " Growth in half year ended Sep 2025 is 220.26% vs 150.82% in Sep 2024",
        "dir": 1
      },
      {
        "prefix": "Standalone Net Profit ",
        "suffix": " Growth in half year ended Sep 2025 is 2,050.00% vs -89.47% in Sep 2024",
        "dir": 1
      }
    ],
    "table": {
      "header": [
        "Sep'25",
        "Sep'24",
        "Change(%)"
      ],
      "body": [
        {
          "field": "Net Sales",
          "val1": "4.90",
          "val2": "1.53",
          "chgp": "220.26%",
          "chgp_class": "positive"
        },
        {
          "field": "Operating Profit (PBDIT) excl Other Income",
          "val1": "0.39",
          "val2": "-0.11",
          "chgp": "454.55%",
          "chgp_class": "positive"
        },
        {
          "field": "Interest",
          "val1": "1.76",
          "val2": "0.00",
          "chgp": "",
          "chgp_class": "neutral"
        },
        {
          "field": "Exceptional Items",
          "val1": "0.00",
          "val2": "0.00",
          "chgp": "",
          "chgp_class": "neutral"
        },
        {
          "field": "Standalone Net Profit",
          "val1": "0.43",
          "val2": "0.02",
          "chgp": "2,050.00%",
          "chgp_class": "positive"
        },
        {
          "field": "Operating Profit Margin (Excl OI)",
          "val1": "7.96%",
          "val2": "-7.19%",
          "chgp": "15.15%",
          "chgp_class": "positive"
        }
      ]
    }
  },
  {
    "link": "nine-monthly",
    "btn_text": "All Nine Monthly Results",
    "header": "Nine Monthly Results Snapshot (Standalone) - Dec'25",
    "rhs": [
      {
        "prefix": "Net Sales ",
        "suffix": "YoY Growth in nine months ended Dec 2025 is 198.11% vs 126.50% in Dec 2024",
        "dir": 1
      },
      {
        "prefix": "Standalone Net Profit ",
        "suffix": "YoY Growth in nine months ended Dec 2025 is 1,633.33% vs -94.12% in Dec 2024",
        "dir": 1
      }
    ],
    "table": {
      "header": [
        "Dec'25",
        "Dec'24",
        "Change(%)"
      ],
      "body": [
        {
          "field": "Net Sales",
          "val1": "7.90",
          "val2": "2.65",
          "chgp": "198.11%",
          "chgp_class": "positive"
        },
        {
          "field": "Operating Profit (PBDIT) excl Other Income",
          "val1": "1.48",
          "val2": "-0.20",
          "chgp": "840.00%",
          "chgp_class": "positive"
        },
        {
          "field": "Interest",
          "val1": "2.99",
          "val2": "0.00",
          "chgp": "",
          "chgp_class": "neutral"
        },
        {
          "field": "Exceptional Items",
          "val1": "0.00",
          "val2": "0.00",
          "chgp": "",
          "chgp_class": "neutral"
        },
        {
          "field": "Standalone Net Profit",
          "val1": "0.52",
          "val2": "0.03",
          "chgp": "1,633.33%",
          "chgp_class": "positive"
        },
        {
          "field": "Operating Profit Margin (Excl OI)",
          "val1": "18.73%",
          "val2": "-7.55%",
          "chgp": "26.28%",
          "chgp_class": "positive"
        }
      ]
    }
  },
  {
    "link": "annual",
    "btn_text": "All Annual Results",
    "header": "Annual Results Snapshot (Standalone) - Mar'26",
    "rhs": [
      {
        "prefix": "Net Sales ",
        "suffix": "YoY Growth in year ended Mar 2026 is 179.18% vs 138.80% in Mar 2025",
        "dir": 1
      },
      {
        "prefix": "Standalone Net Profit ",
        "suffix": "YoY Growth in year ended Mar 2026 is 169.23% vs -80.00% in Mar 2025",
        "dir": 1
      }
    ],
    "table": {
      "header": [
        "Mar'26",
        "Mar'25",
        "Change(%)"
      ],
      "body": [
        {
          "field": "Net Sales",
          "val1": "12.20",
          "val2": "4.37",
          "chgp": "179.18%",
          "chgp_class": "positive"
        },
        {
          "field": "Operating Profit (PBDIT) excl Other Income",
          "val1": "-0.29",
          "val2": "-0.40",
          "chgp": "27.50%",
          "chgp_class": "positive"
        },
        {
          "field": "Interest",
          "val1": "4.77",
          "val2": "0.96",
          "chgp": "396.87%",
          "chgp_class": "negative"
        },
        {
          "field": "Exceptional Items",
          "val1": "0.00",
          "val2": "0.00",
          "chgp": "",
          "chgp_class": "neutral"
        },
        {
          "field": "Standalone Net Profit",
          "val1": "0.35",
          "val2": "0.13",
          "chgp": "169.23%",
          "chgp_class": "positive"
        },
        {
          "field": "Operating Profit Margin (Excl OI)",
          "val1": "-2.38%",
          "val2": "-9.15%",
          "chgp": "6.77%",
          "chgp_class": "positive"
        }
      ]
    }
  }
]

Quarterly Results Snapshot (Standalone) - Jun'26 - YoYstock-summary

Jun'26
Jun'25
Change(%)
Net Sales
4.90
2.19
123.74%
Operating Profit (PBDIT) excl Other Income
2.41
0.90
167.78%
Interest
1.96
0.81
141.98%
Exceptional Items
0.00
0.00
Standalone Net Profit
0.34
0.09
277.78%
Operating Profit Margin (Excl OI)
49.18%
41.10%
8.08%
Values in Rs Cr.
Direction Arrows
Net Sales

YoY Growth in quarter ended Jun 2026 is 123.74% vs 195.95% in Jun 2025

Direction Arrows
Standalone Net Profit

YoY Growth in quarter ended Jun 2026 is 277.78% vs 80.00% in Jun 2025

Half Yearly Results Snapshot (Standalone) - Sep'25stock-summary

Sep'25
Sep'24
Change(%)
Net Sales
4.90
1.53
220.26%
Operating Profit (PBDIT) excl Other Income
0.39
-0.11
454.55%
Interest
1.76
0.00
Exceptional Items
0.00
0.00
Standalone Net Profit
0.43
0.02
2,050.00%
Operating Profit Margin (Excl OI)
7.96%
-7.19%
15.15%
Values in Rs Cr.
Direction Arrows
Net Sales

Growth in half year ended Sep 2025 is 220.26% vs 150.82% in Sep 2024

Direction Arrows
Standalone Net Profit

Growth in half year ended Sep 2025 is 2,050.00% vs -89.47% in Sep 2024

Nine Monthly Results Snapshot (Standalone) - Dec'25stock-summary

Dec'25
Dec'24
Change(%)
Net Sales
7.90
2.65
198.11%
Operating Profit (PBDIT) excl Other Income
1.48
-0.20
840.00%
Interest
2.99
0.00
Exceptional Items
0.00
0.00
Standalone Net Profit
0.52
0.03
1,633.33%
Operating Profit Margin (Excl OI)
18.73%
-7.55%
26.28%
Values in Rs Cr.
Direction Arrows
Net Sales

YoY Growth in nine months ended Dec 2025 is 198.11% vs 126.50% in Dec 2024

Direction Arrows
Standalone Net Profit

YoY Growth in nine months ended Dec 2025 is 1,633.33% vs -94.12% in Dec 2024

Annual Results Snapshot (Standalone) - Mar'26stock-summary

Mar'26
Mar'25
Change(%)
Net Sales
12.20
4.37
179.18%
Operating Profit (PBDIT) excl Other Income
-0.29
-0.40
27.50%
Interest
4.77
0.96
396.87%
Exceptional Items
0.00
0.00
Standalone Net Profit
0.35
0.13
169.23%
Operating Profit Margin (Excl OI)
-2.38%
-9.15%
6.77%
Values in Rs Cr.
Direction Arrows
Net Sales

YoY Growth in year ended Mar 2026 is 179.18% vs 138.80% in Mar 2025

Direction Arrows
Standalone Net Profit

YoY Growth in year ended Mar 2026 is 169.23% vs -80.00% in Mar 2025

stock-summaryCompany CV
About Richfield Financial Services Ltd stock-summary
stock-summary
Richfield Financial Services Ltd
Micro Cap
Non Banking Financial Company (NBFC)
Richfield Financial Services Limited was initially incorporated as Richfield Portfolio Management Private Limited, as a Private company on 16 April, 1992. The Company became a Public limited company and the name of the Company was changed to Richfield Portfolio Management Limited on December 19, 1994. Further, a change in name of the Company to 'Richfield Financial Services Limited' was made effective in 1995.
Company Coordinates stock-summary
Company Details
33 Brabourne Road, 5th Floor Kolkata West Bengal : 700001
stock-summary
Tel: 91-33-2242-5812
stock-summary
rfsl.nbfc@gmail.com
Registrar Details
Niche Technologies Pvt Ltd , D-511, Bagree Market 5th Floor, 71 B R B B Road , Kolkata