
Compare Ruparel Food with Similar Stocks
Stock DNA
Housing Finance Company
INR 40 Cr (Micro Cap)
NA (Loss Making)
13
0.00%
0.00
-3.40%
8.83
Total Returns (Price + Dividend) 
Ruparel Food for the last several years.
Risk Adjusted Returns v/s
Returns Beta

News

Ruparel Food Products Ltd is Rated Strong Sell
Ruparel Food Products Ltd is rated Strong Sell by MarketsMOJO. This rating was last updated on 23 Oct 2025, reflecting a shift from the previous 'Sell' grade. However, the analysis and financial metrics discussed here represent the stock's current position as of 18 June 2026, providing investors with an up-to-date view of the company’s performance and outlook.
Read full news article
Ruparel Food Products Ltd is Rated Strong Sell
Ruparel Food Products Ltd is rated Strong Sell by MarketsMOJO, with this rating last updated on 23 Oct 2025. However, the analysis and financial metrics discussed here reflect the stock’s current position as of 08 June 2026, providing investors with an up-to-date view of the company’s fundamentals, valuation, financial trends, and technical outlook.
Read full news article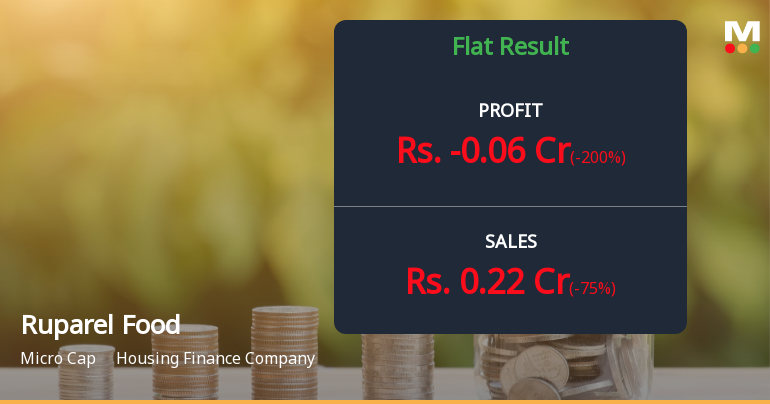
Ruparel Food Products Q4 FY26: Mounting Losses Signal Deepening Distress
Ruparel Food Products Ltd., a micro-cap housing finance company with a market capitalisation of ₹45.00 crores, reported a net loss of ₹0.06 crores in Q4 FY26 (Mar'26), marking a dramatic deterioration from the marginal profit of ₹0.01 crores recorded in Q4 FY25. The loss widened by 200.00% on a quarter-on-quarter basis and represented a 700.00% decline year-on-year, underscoring severe operational challenges. Following the results, the stock traded at ₹145.00 on June 02, 2026, down 1.36% from the previous close, reflecting investor concerns about the company's deteriorating financial trajectory.
Read full news article Announcements
Announcement under Regulation 30 (LODR)-Newspaper Publication
01-Jun-2026 | Source : BSENewspaper publication of abridged version of Financial Results for March 31 2026
Financial Results For March 31 2026
30-May-2026 | Source : BSEFinancial Results (Standalone and Consolidated) for March 31 2026
Board Meeting Outcome for Outcome Of Board Meeting
30-May-2026 | Source : BSEOutcome of Board Meeting for quarter ended March 31 2026
Corporate Actions

No Upcoming Board Meetings

No Dividend history available

No Splits history available

No Bonus history available

No Rights history available
Quality key factors
Valuation key factors
Technicals key factors
 Technical Indicator Scale: Bearish, Mildly Bearish, Sideways, Mildly Bullish, Bullish Turned
 Shareholding Snapshot : Mar 2026
Shareholding Compare (%holding)
Promoters
None
Held by 0 Schemes
Held by 0 FIIs
Ruparel Pankajkumar Ranchhoddas Huf (18.15%)
Bhavna Darshan Mehta (2.12%)
26.65%
Quarterly Results Snapshot (Standalone) - Mar'26 - QoQ

QoQ Growth in quarter ended Mar 2026 is -75.00% vs -62.23% in Dec 2025
QoQ Growth in quarter ended Mar 2026 is -200.00% vs -100.00% in Dec 2025
Half Yearly Results Snapshot (Standalone) - Sep'25

Growth in half year ended Sep 2025 is 14.22% vs 0.00% in Sep 2024
Growth in half year ended Sep 2025 is 11.11% vs 10.00% in Sep 2024
Nine Monthly Results Snapshot (Standalone) - Dec'25
YoY Growth in nine months ended Dec 2025 is 57.35% vs 0.00% in Dec 2024
YoY Growth in nine months ended Dec 2025 is 28.57% vs 0.00% in Dec 2024
Annual Results Snapshot (Consolidated) - Mar'26
YoY Growth in year ended Mar 2026 is -31.26% vs 0.00% in Mar 2025
YoY Growth in year ended Mar 2026 is -14.29% vs 30.00% in Mar 2025
About Ruparel Food Products Ltd

Company Coordinates


