
Compare S.A.L Steel with Similar Stocks
Dashboard
High Debt company with Weak Long Term Fundamental Strength
- Poor long term growth as Net Sales has grown by an annual rate of -8.46% and Operating profit at -21.21% over the last 5 years
- High Debt Company with a Debt to Equity ratio (avg) of 3.40 times
- The company has been able to generate a Return on Equity (avg) of 8.98% signifying low profitability per unit of shareholders funds
With a fall in Net Sales of -84.68%, the company declared Very Negative results in Mar 26
With ROCE of 0.8, it has a Very Expensive valuation with a 2.4 Enterprise value to Capital Employed
Stock DNA
Ferrous Metals
INR 837 Cr (Micro Cap)
NA (Loss Making)
26
0.00%
2.38
-9.68%
5.73
Total Returns (Price + Dividend) 
S.A.L Steel for the last several years.
Risk Adjusted Returns v/s
Returns Beta

News
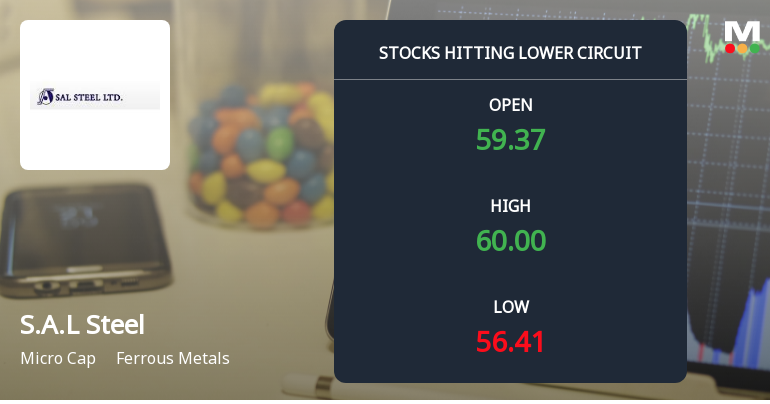
S.A.L Steel Ltd Locks at Lower Circuit With 3.09% Loss — Sellers Queue, No Buyers in Sight
At Rs 56.25, sellers were still queuing — but there were no buyers willing to take the other side. S.A.L Steel Ltd locked at its lower circuit of 3.09% on 11 Jun 2026, with unfilled sell orders and a frozen price that capped losses for the day.
Read full news article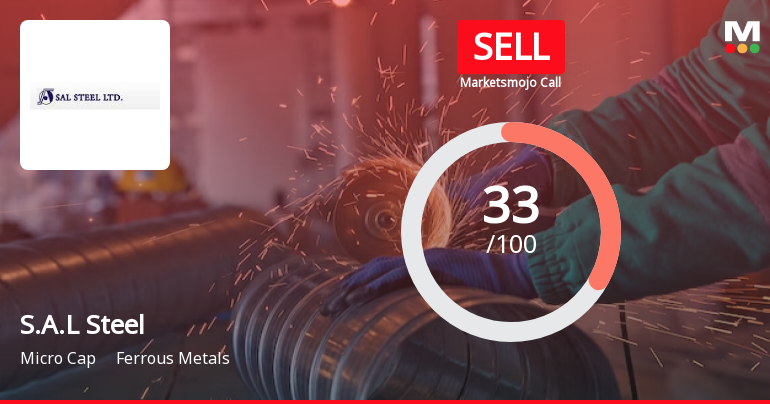
S.A.L Steel Ltd is Rated Sell
S.A.L Steel Ltd is rated 'Sell' by MarketsMOJO, with this rating last updated on 10 April 2026. However, the analysis and financial metrics discussed here reflect the stock's current position as of 09 June 2026, providing investors with the latest insights into the company’s performance and outlook.
Read full news article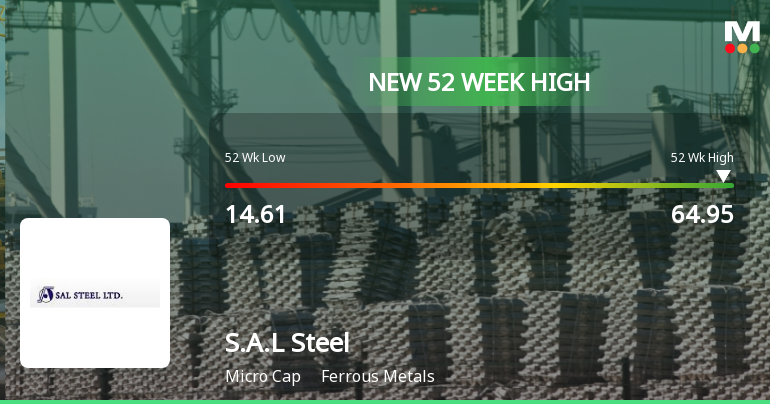
Broad-Based Technical Strength Lifts S.A.L Steel Ltd to 52-Week High of Rs 64.95
From a low of Rs 14.61 to a new peak of Rs 64.95, S.A.L Steel Ltd has surged an impressive 343% over the past year, outpacing the Sensex which declined 8.59% in the same period. This remarkable rally culminated in the stock hitting its all-time high on 4 June 2026, fuelled by a confluence of strong technical signals and sustained price momentum.
Read full news article Announcements
Announcement Under Regulation 30 SEBI (LODR) Regulation 2015- News Paper Publication
30-May-2026 | Source : BSESubmission of News Paper publication for Audited Financial Result for the Quarter and Year ended on March 31 2026
Announcement Under Regulation 30 SEBI (LODR) Regulation 2015- Statement Of Deviation Or Variation(S) In The Proceeds Of Equity Share/Warrants Under Regulation 32 Of SEBI (LODR) Regulation 2015 For The Quarter Ended March 31 2026
30-May-2026 | Source : BSEAnnouncement under Regulation 30 of SEBI (LODR) Regulation 2015- Statement of Deviation or Variation(s) in the proceeds of Equity share/Warrants under Regulation 32 of SEB (LODR) Regulation 2015 for the Quarter ended March 312026
Appointment Of M/S NRPS & Associates LLP Chartered Accountants As An Internal Auditor Of The Company
29-May-2026 | Source : BSEAppointment of M/s NRPS & Associates LLP Chartered Accountant as an Internal Auditor of the Company
Corporate Actions

No Upcoming Board Meetings

No Dividend history available

No Splits history available

No Bonus history available

No Rights history available
Quality key factors
Valuation key factors
Technicals key factors
 Technical Indicator Scale: Bearish, Mildly Bearish, Sideways, Mildly Bullish, Bullish Turned
 Shareholding Snapshot : Mar 2026
Shareholding Compare (%holding)
Promoters
18.9758
Held by 0 Schemes
Held by 1 FIIs (0.0%)
Sree Metaliks Limited (43.58%)
Vora Financial Services Pvt Ltd (4.03%)
21.41%
Quarterly Results Snapshot (Standalone) - Mar'26 - QoQ

QoQ Growth in quarter ended Mar 2026 is 442.27% vs -96.65% in Dec 2025

QoQ Growth in quarter ended Mar 2026 is -115.38% vs 77.75% in Dec 2025
Half Yearly Results Snapshot (Standalone) - Sep'25
Growth in half year ended Sep 2025 is -17.47% vs -24.52% in Sep 2024
Growth in half year ended Sep 2025 is -2,804.55% vs -8.33% in Sep 2024
Nine Monthly Results Snapshot (Standalone) - Dec'25
YoY Growth in nine months ended Dec 2025 is -54.30% vs -2.16% in Dec 2024
YoY Growth in nine months ended Dec 2025 is 247.83% vs 79.46% in Dec 2024
Annual Results Snapshot (Standalone) - Mar'26
YoY Growth in year ended Mar 2026 is -61.88% vs -5.64% in Mar 2025
YoY Growth in year ended Mar 2026 is 94.56% vs -1,468.09% in Mar 2025
About S.A.L Steel Ltd

Company Coordinates


