
Compare Salasar Techno with Similar Stocks
Dashboard
Low ability to service debt as the company has a high Debt to EBITDA ratio of 3.76 times
- Low ability to service debt as the company has a high Debt to EBITDA ratio of 3.76 times
- The company has been able to generate a Return on Equity (avg) of 7.87% signifying low profitability per unit of shareholders funds
Poor long term growth as Operating profit has grown by an annual rate 11.06% of over the last 5 years
The company has declared negative results for the last 2 consecutive quarters
Below par performance in long term as well as near term
Stock DNA
Industrial Manufacturing
INR 1,148 Cr (Micro Cap)
71.00
36
0.00%
0.45
2.07%
1.35
Total Returns (Price + Dividend) 
Latest dividend: 0.1 per share ex-dividend date: Sep-15-2023
Risk Adjusted Returns v/s
Returns Beta

News
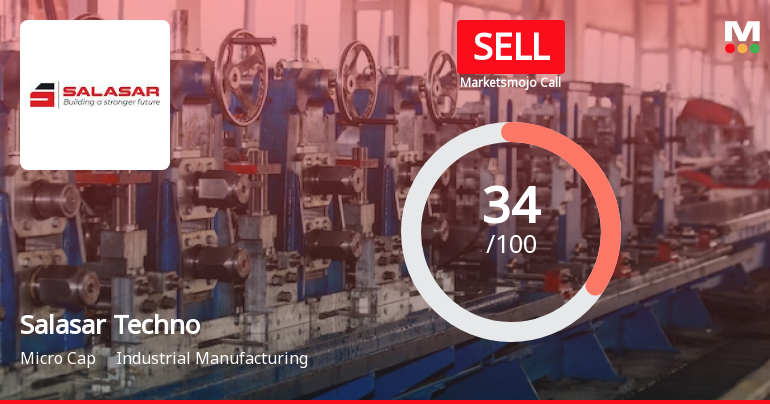
Salasar Techno Engineering Ltd is Rated Sell
Salasar Techno Engineering Ltd is rated 'Sell' by MarketsMOJO, with this rating last updated on 02 March 2026. However, the analysis and financial metrics discussed here reflect the stock's current position as of 10 June 2026, providing investors with an up-to-date view of the company’s fundamentals, returns, and overall outlook.
Read full news articleAre Salasar Techno Engineering Ltd latest results good or bad?
Salasar Techno Engineering Ltd's latest financial results for the quarter ended March 2026 highlight significant operational challenges. The company reported a net sales decline of 8.00% year-on-year, totaling ₹444.65 crores, which is a stark contrast to the previous year's growth. The operating profit margin also contracted sharply to 3.15%, down from 5.68% in the same quarter last year, indicating a substantial erosion in profitability. The net profit for the quarter was recorded at a loss of ₹12.49 crores, reflecting a drastic decline of 135.66% compared to the previous year. This loss was exacerbated by an interest coverage ratio that fell to 0.98 times, the lowest on record, suggesting that the company's operating profits are insufficient to meet its interest obligations. The operational performance was further marred by a negative cash flow from operations, which turned to ₹-5.00 crores, a significan...
Read full news article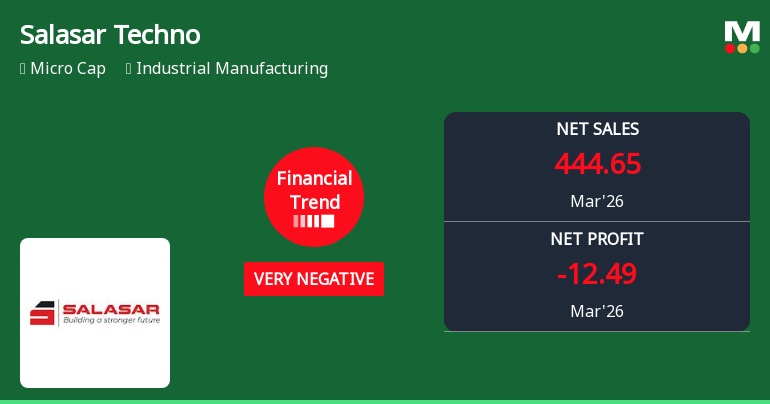
Salasar Techno Engineering Ltd Reports Sharp Decline in Quarterly Financial Performance Amidst Negative Trend
Salasar Techno Engineering Ltd has reported a significant deterioration in its financial performance for the quarter ended March 2026, with key metrics showing marked declines compared to previous periods. The company’s revenue contracted by 8.0%, while profitability indicators plunged to multi-quarter lows, signalling mounting operational and financial pressures within the industrial manufacturing sector.
Read full news article Announcements
Shareholder Meeting / Postal Ballot-Scrutinizers Report
09-Jun-2026 | Source : BSEPlease find enclosed herewith copy of Voting Results & Scrutinizer report of Court Convened meeting of Equity Shareholders Secured Creditors & Unsecured Creditors of the Company held on June 05 2026.
Shareholder Meeting / Postal Ballot-Outcome of Court Convened Meeting
06-Jun-2026 | Source : BSEPlease find enclosed proceeding of court convened meeting of Equity Shareholders Secured Creditors & Unsecured Creditors of the Company held on June 05 2026.
Announcement under Regulation 30 (LODR)-Newspaper Publication
30-May-2026 | Source : BSEPlease find enclosed herewith copy of newspaper publication for Audited Financial results for quarter & year ended 31.03.2026.
Corporate Actions

No Upcoming Board Meetings

Salasar Techno Engineering Ltd has declared 10% dividend, ex-date: 15 Sep 23

Salasar Techno Engineering Ltd has announced 1:10 stock split, ex-date: 27 Jun 22

Salasar Techno Engineering Ltd has announced 4:1 bonus issue, ex-date: 01 Feb 24

No Rights history available
Quality key factors
Valuation key factors
Technicals key factors
 Technical Indicator Scale: Bearish, Mildly Bearish, Sideways, Mildly Bullish, Bullish Turned
 Shareholding Snapshot : Mar 2026
Shareholding Compare (%holding)
Non Institution
4.8447
Held by 0 Schemes
Held by 26 FIIs (4.97%)
Hill View Infrabuild Limited (16.44%)
Eminence Global Fund Pcc- Eubilia Capital Partners Fund I (1.58%)
40.89%
Quarterly Results Snapshot (Consolidated) - Mar'26 - YoY

YoY Growth in quarter ended Mar 2026 is -8.00% vs 31.57% in Mar 2025
YoY Growth in quarter ended Mar 2026 is -135.66% vs -131.23% in Mar 2025
Half Yearly Results Snapshot (Consolidated) - Sep'25

Growth in half year ended Sep 2025 is 26.39% vs 7.13% in Sep 2024
Growth in half year ended Sep 2025 is 20.91% vs 4.64% in Sep 2024
Nine Monthly Results Snapshot (Consolidated) - Dec'25
YoY Growth in nine months ended Dec 2025 is 11.30% vs 13.03% in Dec 2024
YoY Growth in nine months ended Dec 2025 is -7.59% vs -10.60% in Dec 2024
Annual Results Snapshot (Consolidated) - Mar'26
YoY Growth in year ended Mar 2026 is 3.82% vs 19.78% in Mar 2025
YoY Growth in year ended Mar 2026 is -9.84% vs -63.91% in Mar 2025
About Salasar Techno Engineering Ltd

Company Coordinates


