
Compare Samrat Forgings with Similar Stocks
Stock DNA
Castings & Forgings
INR 134 Cr (Micro Cap)
30.00
NA
0.00%
2.30
10.61%
3.23
Total Returns (Price + Dividend) 
Samrat Forgings for the last several years.
Risk Adjusted Returns v/s
Returns Beta

News
Are Samrat Forgings Ltd latest results good or bad?
Samrat Forgings Ltd's financial results for Q4 FY26 reveal a complex operational landscape characterized by mixed performance metrics. The company reported net sales of ₹50.82 crores, reflecting a sequential growth of 2.09% from the previous quarter, although this represents a decline of 1.44% compared to the same quarter last year. This modest growth in revenue indicates ongoing challenges in the demand environment within the forgings sector. However, net profit for the quarter was ₹1.04 crores, which shows a significant reduction of 30.20% from the previous quarter, despite a year-on-year increase of 42.47%. This contrasting performance highlights the volatility in profitability, primarily driven by escalating interest costs, which reached ₹2.26 crores—an all-time high for the company. The interest expenses consumed a substantial portion of operating profit, raising concerns about the company's financial...
Read full news article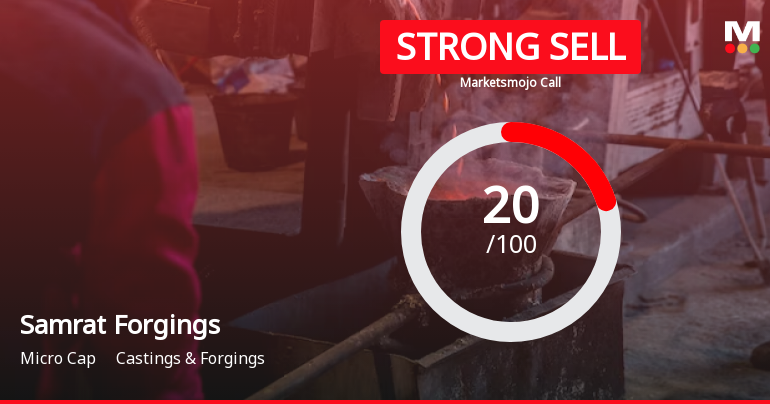
Samrat Forgings Ltd is Rated Strong Sell
Samrat Forgings Ltd is rated Strong Sell by MarketsMOJO. This rating was last updated on 21 July 2025. However, the analysis and financial metrics discussed here reflect the stock’s current position as of 02 June 2026, providing investors with the latest insights into the company’s performance and outlook.
Read full news article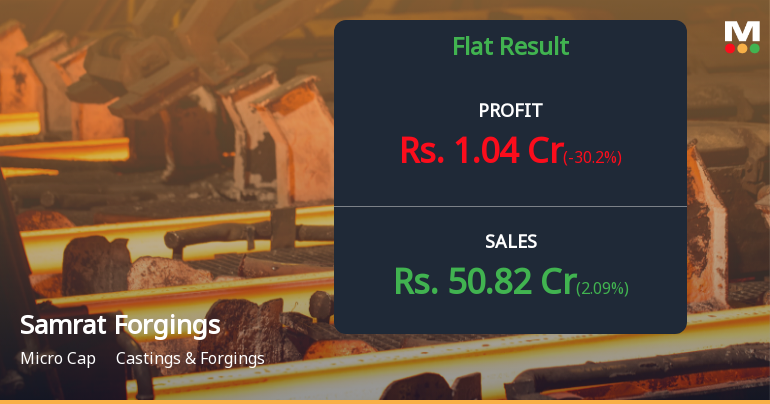
Samrat Forgings Q4 FY26: Margin Pressures Mount as Interest Costs Surge
Samrat Forgings Limited, a micro-cap player in India's castings and forgings sector, reported a net profit of ₹1.04 crores for Q4 FY26 (March 2026 quarter), marking a sequential decline of 30.20% from ₹1.49 crores in Q3 FY26 but showing a year-on-year improvement of 42.47% from ₹0.73 crores in Q4 FY25. The company, with a market capitalisation of ₹101.00 crores, continues to grapple with elevated interest costs and margin compression despite modest revenue growth.
Read full news article Announcements
Announcement under Regulation 30 (LODR)-Newspaper Publication
01-Jun-2026 | Source : BSENewspaper Publication of audited results for the fourth quarter and year ended 31.03.2026
Audited Results For The Fourth Quarter And Year Ended 31.03.2026
30-May-2026 | Source : BSEAudited results for the fourth quarter and year ended 31.03.2026
Board Meeting Outcome for Outcome Of Board Meeting
30-May-2026 | Source : BSEOutcome of Board Meeting
Corporate Actions

No Upcoming Board Meetings

No Dividend history available

No Splits history available

No Bonus history available

No Rights history available
Quality key factors
Valuation key factors
Technicals key factors
 Technical Indicator Scale: Bearish, Mildly Bearish, Sideways, Mildly Bullish, Bullish Turned
 Shareholding Snapshot : Mar 2026
Shareholding Compare (%holding)
Promoters
None
Held by 0 Schemes
Held by 0 FIIs
Jandwani Poly Products Private Limited (27.22%)
Prem Lal (9.99%)
20.33%
Quarterly Results Snapshot (Standalone) - Mar'26 - QoQ

QoQ Growth in quarter ended Mar 2026 is 2.09% vs -3.90% in Dec 2025

QoQ Growth in quarter ended Mar 2026 is -30.20% vs 83.95% in Dec 2025
Half Yearly Results Snapshot (Standalone) - Sep'25
Growth in half year ended Sep 2025 is 7.06% vs 7.44% in Sep 2024
Growth in half year ended Sep 2025 is -42.06% vs 44.59% in Sep 2024
Nine Monthly Results Snapshot (Standalone) - Dec'25
YoY Growth in nine months ended Dec 2025 is 9.06% vs 13.81% in Dec 2024
YoY Growth in nine months ended Dec 2025 is -23.34% vs 87.55% in Dec 2024
Annual Results Snapshot (Standalone) - Mar'26
YoY Growth in year ended Mar 2026 is 6.23% vs 17.92% in Mar 2025
YoY Growth in year ended Mar 2026 is -13.92% vs 71.72% in Mar 2025
About Samrat Forgings Ltd

Company Coordinates


