
Compare Sanjiv.Parant. with Similar Stocks
Stock DNA
Pharmaceuticals & Biotechnology
INR 172 Cr (Micro Cap)
26.00
33
0.36%
0.27
13.89%
3.57
Total Returns (Price + Dividend) 
Latest dividend: 0.5 per share ex-dividend date: Sep-19-2025
Risk Adjusted Returns v/s
Returns Beta

News

Sanjivani Paranteral Ltd Upgraded to Sell on Improved Valuation and Financial Metrics
Sanjivani Paranteral Ltd has seen its investment rating upgraded from Strong Sell to Sell, driven primarily by a significant improvement in valuation metrics despite ongoing financial challenges. The pharmaceutical micro-cap’s recent performance and fundamental parameters have been carefully analysed, revealing a complex picture of valuation attractiveness counterbalanced by deteriorating quarterly financial results and subdued market returns.
Read full news article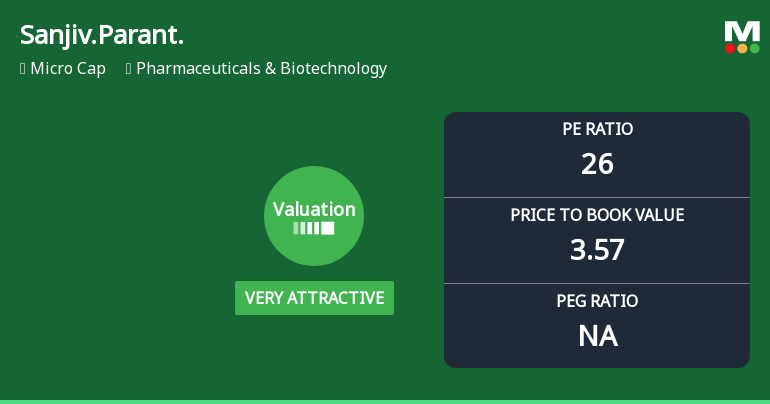
Sanjivani Paranteral Ltd Valuation Shifts Signal Renewed Price Attractiveness
Sanjivani Paranteral Ltd, a micro-cap player in the Pharmaceuticals & Biotechnology sector, has witnessed a notable shift in its valuation parameters, moving from a fair to a very attractive rating. Despite recent share price declines, the company’s improved price-to-earnings and price-to-book ratios relative to peers and historical averages suggest a compelling entry point for discerning investors.
Read full news article
Sanjivani Paranteral Ltd is Rated Strong Sell
Sanjivani Paranteral Ltd is rated Strong Sell by MarketsMOJO, with this rating last updated on 21 May 2026. While the rating change occurred on that date, the analysis and financial metrics presented here reflect the stock’s current position as of 02 June 2026, providing investors with the most up-to-date view of the company’s performance and outlook.
Read full news article Announcements
Compliances-Reg.24(A)-Annual Secretarial Compliance
29-May-2026 | Source : BSEAnnual Secretarial Compliance Report for the financial year ended 31st March 2026
Board Meeting Outcome for Outcome Of Board Meeting Held On Thursday 21St May 2026
21-May-2026 | Source : BSEDear Sir/Madam Pursuant to Regulation 30 of the Securities and Exchange Board of India (Listing Obligations and Disclosure Requirements) Regulations 2015 (SEBI Listing Regulations) we wish to inform you that the Board of Directors of the Company at its meeting held today i.e. Thursday 21st May 2026 inter alia considered and approved the appointment of Mr. Bhavesh M. Rathod Chartered Accountants Registered Valuer for carrying out valuation and determination of issue price of the proposed warrants to be issued by way of preferential issue
Announcement under Regulation 30 (LODR)-Earnings Call Transcript
20-May-2026 | Source : BSEEarnings call Transcript as on dated 15th May 2026
Corporate Actions

No Upcoming Board Meetings

Sanjivani Paranteral Ltd has declared 5% dividend, ex-date: 19 Sep 25

No Splits history available

No Bonus history available

No Rights history available
Quality key factors
Valuation key factors
Technicals key factors
 Technical Indicator Scale: Bearish, Mildly Bearish, Sideways, Mildly Bullish, Bullish Turned
 Shareholding Snapshot : Mar 2026
Shareholding Compare (%holding)
Non Institution
None
Held by 0 Schemes
Held by 0 FIIs
Ashwani Khemka (29.57%)
Suresh Pukhraj Jain . (6.89%)
50.05%
Quarterly Results Snapshot (Consolidated) - Mar'26 - QoQ

QoQ Growth in quarter ended Mar 2026 is -40.12% vs 42.32% in Dec 2025
QoQ Growth in quarter ended Mar 2026 is -80.22% vs 69.51% in Dec 2025
Half Yearly Results Snapshot (Standalone) - Sep'25
Growth in half year ended Sep 2025 is -3.41% vs 30.06% in Sep 2024
Growth in half year ended Sep 2025 is -15.96% vs 23.01% in Sep 2024
Nine Monthly Results Snapshot (Standalone) - Dec'25
YoY Growth in nine months ended Dec 2025 is 4.49% vs 24.99% in Dec 2024
YoY Growth in nine months ended Dec 2025 is 1.35% vs 20.37% in Dec 2024
Annual Results Snapshot (Consolidated) - Mar'26
YoY Growth in year ended Mar 2026 is -2.04% vs 28.84% in Mar 2025
YoY Growth in year ended Mar 2026 is -17.31% vs 31.12% in Mar 2025
About Sanjivani Paranteral Ltd

Company Coordinates


