
Compare Sarla Performanc with Similar Stocks
Dashboard
Company has a Debt to Equity ratio (avg) of 0.19 times
Poor long term growth as Operating profit has grown by an annual rate -15.30% of over the last 5 years
Negative results in Mar 26
With ROCE of 2.1, it has a Expensive valuation with a 1.5 Enterprise value to Capital Employed
Despite the size of the company, domestic mutual funds hold only 0% of the company
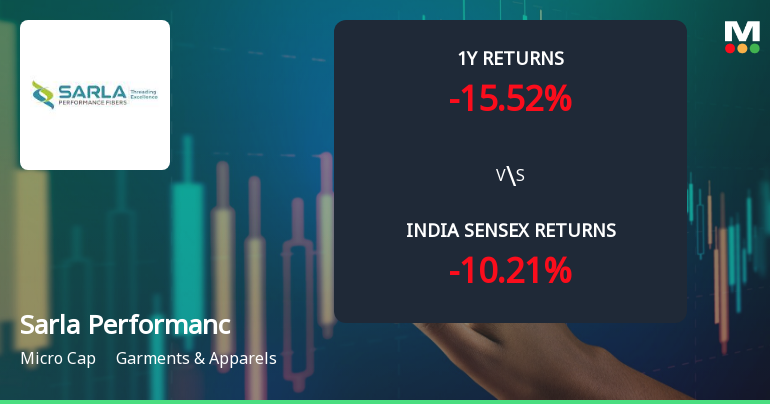
Underperformed the market in the last 1 year
Stock DNA
Garments & Apparels
INR 814 Cr (Micro Cap)
13.00
23
3.09%
0.22
12.43%
1.57
Total Returns (Price + Dividend) 
Latest dividend: 3 per share ex-dividend date: Jun-18-2025
Risk Adjusted Returns v/s
Returns Beta

News
Sarla Performance Fibers Ltd: Technical Momentum Shifts Amid Mixed Signals
Sarla Performance Fibers Ltd, a micro-cap player in the Garments & Apparels sector, has experienced a nuanced shift in its technical momentum, moving from a bullish to a mildly bullish stance. Despite a modest day decline of 1.58%, the stock’s technical indicators reveal a complex interplay of bullish and bearish signals, suggesting cautious optimism for investors analysing its near-term trajectory.
Read full news article
Sarla Performance Fibers Ltd Upgraded to Hold on Technical and Valuation Shifts
Sarla Performance Fibers Ltd, a micro-cap player in the Garments & Apparels sector, has seen its investment rating upgraded from Sell to Hold as of 09 Jun 2026. This change reflects a nuanced reassessment across four key parameters: quality, valuation, financial trend, and technicals. Despite recent financial challenges, the stock’s improved technical indicators and valuation metrics have prompted a more cautious but optimistic stance among analysts.
Read full news article
Sarla Performance Fibers Ltd Technical Momentum Shifts to Bullish Amid Mixed Indicators
Sarla Performance Fibers Ltd, a micro-cap player in the Garments & Apparels sector, has exhibited a notable shift in its technical momentum, transitioning from a sideways trend to a bullish stance. This change is underscored by a mix of technical indicators signalling improving price strength, suggesting renewed investor interest and potential upside in the near term.
Read full news article Announcements
Announcement under Regulation 30 (LODR)-Closure of Buy Back
09-Jun-2026 | Source : BSESubmission of certificate of extinguishment of 4000000 equity shares of Re.1/- of the Company bought back from the shareholders of the Company under Buyback Offer.
Announcement under Regulation 30 (LODR)-Newspaper Publication
05-Jun-2026 | Source : BSEPost Buyback Public Announcement
Announcement under Regulation 30 (LODR)-Post Buyback Public Announcement
05-Jun-2026 | Source : BSEPost Buyback Public Announcement
Corporate Actions

No Upcoming Board Meetings

Sarla Performance Fibers Ltd has declared 200% dividend, ex-date: 22 Jul 26

Sarla Performance Fibers Ltd has announced 1:10 stock split, ex-date: 29 Oct 15

No Bonus history available

No Rights history available
Quality key factors
Valuation key factors
Technicals key factors
 Technical Indicator Scale: Bearish, Mildly Bearish, Sideways, Mildly Bullish, Bullish Turned
 Shareholding Snapshot : Mar 2026
Shareholding Compare (%holding)
Promoters
None
Held by 0 Schemes
Held by 2 FIIs (0.78%)
Satidham Industries Pvt.ltd. (28.9%)
Anil Kumar Goel (2.99%)
31.59%
Quarterly Results Snapshot (Consolidated) - Mar'26 - QoQ

QoQ Growth in quarter ended Mar 2026 is 14.94% vs -16.72% in Dec 2025

QoQ Growth in quarter ended Mar 2026 is -1,262.57% vs -72.94% in Dec 2025
Half Yearly Results Snapshot (Consolidated) - Sep'25
Growth in half year ended Sep 2025 is -6.76% vs 24.03% in Sep 2024
Growth in half year ended Sep 2025 is 15.33% vs 178.36% in Sep 2024
Nine Monthly Results Snapshot (Consolidated) - Dec'25
YoY Growth in nine months ended Dec 2025 is -8.59% vs 17.79% in Dec 2024
YoY Growth in nine months ended Dec 2025 is -6.36% vs 131.78% in Dec 2024
Annual Results Snapshot (Consolidated) - Mar'26
YoY Growth in year ended Mar 2026 is -6.06% vs 11.44% in Mar 2025
YoY Growth in year ended Mar 2026 is -121.06% vs 89.49% in Mar 2025
About Sarla Performance Fibers Ltd

Company Coordinates


