Secmark Consult.

  • Market Cap: Micro Cap
  • Industry: Computers - Software & Consulting
  • ISIN: INE0BTM01013
  • NSEID: SECMARK
  • BSEID: 543234
INR
111.67
3.66 (3.39%)
BSENSE

Jan 19

BSE+NSE Vol: 1.28 k

  • Price Points
  • Score
  • Mojo Parameters
  • Total Return
  • News and Corporate Actions
  • Key factors
  • Shareholding
  • Financials
  • CompanyCV
stock-summaryPrice Point
High/Low

1Day

52 Week

Valuation
Technical
Day's Volume

CASH

1.28 k (92.02%) Volume

Shareholding (Sep 2025)

FII

0.00%

Held by 0 FIIs

DII

0.00%

Held by 0 DIIs

Promoter

75.00%

Who are in the management team of Secmark Consult.?

06-Jun-2025

As of March 2023, the management team of Secmark Consult includes Sagar Mansukhbhai Thanki (Executive Director & CFO), Binod Chandra Maharana (Chairman & Independent Director), Priti Nigam Gandhi (Independent Director), Shardul Jashwantlal Shah (Non Executive Director), Ravi Vijay Ramaiya (Managing Director & CEO), Sunil Kumar Bang (Company Secretary & Compliance Officer), and Michael Nanson D'Souza (Executive Director).

As of March 2023, the management team of Secmark Consult includes the following individuals:<BR><BR>1. Sagar Mansukhbhai Thanki - Executive Director & CFO<BR>2. Binod Chandra Maharana - Chairman & Independent Director<BR>3. Priti Nigam Gandhi - Independent Director<BR>4. Shardul Jashwantlal Shah - Non Executive Director<BR>5. Ravi Vijay Ramaiya - Managing Director & CEO<BR>6. Sunil Kumar Bang - Company Secretary & Compliance Officer<BR>7. Michael Nanson D'Souza - Executive Director<BR><BR>These individuals play key roles in the governance and management of the company.

View full answer

What is the bonus history of the Secmark Consult.?

06-Jun-2025

Secmark Consult announced a 3:2 bonus issue on October 12, 2022, where shareholders received three shares for every two held, with both the record date and ex-date on the same day.

Secmark Consult has a bonus history that includes a 3:2 bonus issue announced on October 12, 2022. This means that for every two shares held, shareholders received three shares. The record date and ex-date for this bonus issue were both on October 12, 2022. If you have any more questions about the company or its financial actions, feel free to ask!

View full answer

Has Secmark Consult. declared dividend?

06-Jun-2025

No Dividend History Available

Who are the peers of the Secmark Consult.?

03-Jun-2025

Secmark Consult.'s peers include TCS, Infosys, HCL Technologies, Wipro, Tech Mahindra, Edvenswa Enter, R S Software (I), Elnet Technolog, and Athena Global. Secmark Consult. shows good growth and capital structure, with a 1-year return of 50.31%, outperforming most peers.

Peers: The peers of Secmark Consult. are TCS, Infosys, HCL Technologies, Wipro, Tech Mahindra, Edvenswa Enter, R S Software (I), Elnet Technolog, and Athena Global.<BR><BR>Quality Snapshot: Excellent management risk is observed at TCS, Infosys, and HCL Technologies, while Average management risk is found at Secmark Consult., Edvenswa Enter, R S Software (I), Elnet Technolog, and the rest. Good growth is noted at Secmark Consult., TCS, Infosys, and the rest, while Average growth is seen at HCL Technologies, and Below Average growth is present at Wipro, Tech Mahindra, R S Software (I), Elnet Technolog, Athena Global, and the rest. Excellent capital structure is attributed to TCS, Infosys, HCL Technologies, Wipro, Tech Mahindra, Edvenswa Enter, and Elnet Technolog, while Good capital structure is noted at Secmark Consult., and Below Average capital structure is found at R S Software (I) and Athena Global.<BR><BR>Return Snapshot: The peer with the highest 1-year return is HCL Technologies at 24.61%, while R S Software (I) has the lowest at -70.98%. Secmark Consult.'s 1-year return of 50.31% is significantly higher than both. Additionally, R S Software (I) and Edvenswa Enter have negative six-month returns.

View full answer

What is the technical trend for Secmark Consult.?

09-Jun-2025

As of May 21, 2025, Secmark Consult shows a bullish technical trend supported by strong momentum indicators, although Dow Theory presents a mildly bearish outlook on the weekly chart.

As of 21 May 2025, the technical trend for Secmark Consult has changed from sideways to bullish. The weekly and monthly MACD readings are bullish, indicating strong momentum. Bollinger Bands are also bullish on both time frames, suggesting price strength. Daily moving averages confirm a bullish stance. The KST is bullish weekly and monthly, while the On-Balance Volume (OBV) supports the bullish trend as well. However, Dow Theory indicates a mildly bearish stance on the weekly chart, which slightly tempers the overall bullish outlook. Overall, the current technical stance is bullish with strong momentum indicators, despite some mixed signals from Dow Theory.

View full answer

What does Secmark Consult. do?

17-Jul-2025

Secmark Consultancy Ltd is a Micro Cap company in the Computers - Software & Consulting industry, reporting net sales of 125 Cr and a net profit of 39 Cr for the quarter ending March 2025. It was incorporated in 2011 and became a public company in 2020.

Overview:<BR>Secmark Consultancy Ltd operates in the Computers - Software & Consulting industry and is categorized as a Micro Cap company.<BR><BR>History:<BR>Secmark Consultancy Ltd was originally incorporated as a Private Limited Company on August 03, 2011, and later converted into a Public Limited Company following a shareholders' resolution on January 28, 2020. The most recent quarterly results reported net sales and net profit for the period ending March 2025.<BR><BR>Financial Snapshot:<BR>- Net Sales: 125 Cr (Quarterly Results - Mar 2025)<BR>- Net Profit: 39 Cr (Quarterly Results - Mar 2025)<BR>- Market Cap: INR 152 Cr (Micro Cap)<BR><BR>Key Metrics:<BR>- P/E: 34.00<BR>- Industry P/E: 29<BR>- Dividend Yield: 0.00%<BR>- Debt Equity: -0.48<BR>- Return on Equity: 20.92%<BR>- Price to Book: 7.34<BR><BR>Contact Details:<BR>Details: No Company Details Available<BR>Registrar Address: Not available.

View full answer

Who are the top shareholders of the Secmark Consult.?

17-Jul-2025

The top shareholders of Secmark Consult include Secmark Holdings Private Limited with 72.28%, Bp Wealth Management Private Limited at 4.03%, and individual investors holding 18.09%. There are no mutual funds or foreign institutional investors involved.

The top shareholders of Secmark Consult are primarily its promoters. The largest shareholder is Secmark Holdings Private Limited, which holds a significant 72.28% of the company. The highest public shareholder is Bp Wealth Management Private Limited, with a holding of 4.03%. Additionally, individual investors collectively hold 18.09% of the shares. There are currently no mutual funds or foreign institutional investors involved in the company's shareholding.

View full answer

How big is Secmark Consult.?

24-Jul-2025

As of 24th July, Secmark Consultancy Ltd has a market capitalization of 150.00 Cr, with recent net sales of 35.12 Cr and a net profit of 4.29 Cr. The company reported shareholder's funds of 16.01 Cr and total assets of 29.26 Cr for the annual period ending March 2024.

As of 24th July, Secmark Consultancy Ltd has a market capitalization of 150.00 Cr, categorizing it as a Micro Cap company.<BR><BR>In the latest four quarters, Secmark Consultancy Ltd reported Net Sales of 35.12 Cr and a Net Profit of 4.29 Cr.<BR><BR>For the latest annual period ending March 2024, the company had Shareholder's Funds of 16.01 Cr and Total Assets amounting to 29.26 Cr.

View full answer

Are Secmark Consult. latest results good or bad?

14-Aug-2025

Secmark Consultancy's latest results are unfavorable, with net sales declining by 24.3% to Rs 6.65 crore and a Profit After Tax of Rs -0.90 crore, marking a significant drop from previous quarters. Overall, the financial metrics indicate a negative trend in performance.

Secmark Consultancy's latest financial results indicate a concerning performance. For the quarter ending June 2025, the company reported net sales of Rs 6.65 crore, which represents a significant decline of 24.3% compared to the average sales of Rs 8.78 crore from the previous four quarters. <BR><BR>Moreover, the Profit After Tax (PAT) fell dramatically to Rs -0.90 crore, marking a decrease of 183.9% from the average PAT of Rs 1.07 crore in prior quarters. This downward trend is further reflected in the operating profit, which also reached its lowest point in five quarters at Rs -0.38 crore, leading to an operating profit margin of -5.71%.<BR><BR>Overall, the financial metrics show a negative trajectory, with both net sales and profits experiencing substantial declines. This performance suggests that the results are indeed unfavorable for Secmark Consultancy.

View full answer

When is the next results date for Secmark Consult.?

07-Nov-2025

Secmark Consult will declare its results on 12 November 2025.

Secmark Consult will declare its results on 12 November 2025.

View full answer

How has been the historical performance of Secmark Consult.?

13-Nov-2025

Secmark Consult has shown significant growth in net sales and profitability, with net sales increasing from 5.63 Cr in March 2020 to 35.11 Cr in March 2025, and a profit after tax of 4.29 Cr in the latest fiscal year, marking a strong recovery from previous losses. Total assets and cash flow from operating activities also improved, indicating enhanced financial stability.

Answer:<BR>The historical performance of Secmark Consult shows significant growth in net sales and profitability over the years, culminating in a positive profit after tax in the latest fiscal year.<BR><BR>Breakdown:<BR>Secmark Consult's net sales have increased consistently from 5.63 Cr in March 2020 to 35.11 Cr in March 2025, reflecting a strong upward trend. Total operating income followed a similar trajectory, reaching 35.11 Cr in March 2025, up from 3.83 Cr in March 2019. The company's total expenditure, excluding depreciation, has also risen, but at a slower pace, resulting in an operating profit (PBDIT) of 10.20 Cr in March 2025, a significant recovery from a loss of 4.22 Cr in March 2023. Profit before tax turned positive at 5.68 Cr in March 2025, compared to a loss of 6.99 Cr in March 2023, leading to a profit after tax of 4.29 Cr in the latest year, a turnaround from losses in the previous two years. The company's total assets grew to 33.17 Cr in March 2025, while total liabilities increased to 33.17 Cr as well, indicating a balanced growth in financial standing. Cash flow from operating activities improved to 9.00 Cr in March 2025, up from a negative cash flow of 5.00 Cr in March 2023, showcasing enhanced operational efficiency. Overall, Secmark Consult has demonstrated a robust recovery and growth trajectory in its financial performance.

View full answer

Is Secmark Consult. overvalued or undervalued?

24-Nov-2025

As of November 21, 2025, Secmark Consult. is considered undervalued with an attractive valuation grade, highlighted by a PE ratio of 30.47, a low PEG ratio of 0.45, and exceptional ROCE of 182.92%, despite recent underperformance against the Sensex.

As of 21 November 2025, Secmark Consult. has moved from a fair to an attractive valuation grade. The company is currently considered undervalued, especially given its impressive metrics. The PE ratio stands at 30.47, while the EV to EBITDA ratio is 11.71, and the PEG ratio is notably low at 0.45, indicating strong growth potential relative to its price.<BR><BR>In comparison to its peers, Secmark Consult. has a higher PE ratio than TCS, which is at 22.66, and Infosys, which stands at 22.82. However, it is more favorable than HCL Technologies, which has a PE of 25.69. The company's ROCE is exceptionally high at 182.92%, reflecting efficient capital use, while its ROE is 18.76%. Despite recent underperformance against the Sensex, with a year-to-date return of -0.53% compared to the Sensex's 9.08%, the overall valuation metrics suggest that Secmark Consult. presents a compelling investment opportunity.

View full answer

Should I buy, sell or hold Secmark Consult.?

22-Dec-2025

Why is Secmark Consultancy Ltd falling/rising?

18-Jan-2026

As of 18-Jan, Secmark Consultancy Ltd's stock price is currently at 108.40, showing a slight daily increase despite significant declines over the past week and month. The stock has underperformed its sector and the broader market, with declining investor participation and bearish trading trends indicating ongoing challenges.

As of 18-Jan, Secmark Consultancy Ltd's stock price is rising, currently at 108.40, with a change of 1.4 (1.31%) upwards. Despite this daily increase, the stock has shown a significant decline over various periods, including a 1-week drop of 8.25% and a 1-month decline of 11.04%. This underperformance is further highlighted by the fact that it has lagged behind the Sensex, which has only decreased by 0.01% over the same week.<BR><BR>The stock's performance today is particularly concerning, as it has underperformed its sector by 102.54%, and there has been erratic trading, with the stock not trading on four out of the last twenty days. Additionally, the stock is trading below its 5-day, 20-day, 50-day, 100-day, and 200-day moving averages, indicating a bearish trend.<BR><BR>Investor participation has also fallen sharply, with delivery volume on January 14 dropping by 83.82% compared to the 5-day average. This decline in trading activity suggests a lack of confidence among investors. <BR><BR>While there are positive factors such as a low debt-to-equity ratio, healthy long-term growth in net sales and operating profit, and attractive valuations compared to peers, these have not translated into positive stock performance. The stock has underperformed the broader market over the past year, generating negative returns of -2.78% while the market has seen gains of 7.89%. <BR><BR>In summary, while the stock is experiencing a slight rise today, the broader context of its recent performance and declining investor participation indicates ongoing challenges that may hinder sustained growth.

View full answer

Which are the latest news on Secmark Consult.?

19-Jan-2026

iScoreScore
Click here to find our call on this stock
Strong Sell
Sell
Hold
Buy
Strong Buy

MarketsMojo — Loved in India, Now Global

The power of Mojo is now in 29 countries. Explore global equities with the same cutting-edge features you love.

Dashboard

1

Consistent Underperformance against the benchmark over the last 3 years

  • Along with generating -1.91% returns in the last 1 year, the stock has also underperformed BSE500 in each of the last 3 annual periods
stock-summaryMojo Parameters

Mojo Parameters

Loading Valuation Snapshot...

Stock DNA

stock-summary
Industry

Computers - Software & Consulting

stock-summary
Market cap

INR 113 Cr (Micro Cap)

stock-summary
P/E

29.00

stock-summary
Industry P/E

28

stock-summary
Dividend Yield

0.00%

stock-summary
Debt Equity

-0.88

stock-summary
Return on Equity

18.76%

stock-summary
Price to Book

5.48

Revenue and Profits:
Net Sales:
9 Cr
(Quarterly Results - Sep 2025)
Net Profit:
1 Cr
stock-summaryTotal Returns
Total Returns (Price + Dividend) stock-summary
Dividend Yield (0%)
TimePeriod
Price Return
Dividend Return
Total Return
3 Months
-3.98%
0%
-3.98%
6 Months
-22.64%
0%
-22.64%
1 Year
1.05%
0%
1.05%
2 Years
3.4%
0%
3.4%
3 Years
0%
0%
0.0%
4 Years
0%
0%
0.0%
5 Years
0%
0%
0.0%

Secmark Consult. for the last several years.

Risk Adjusted Returns v/s stock-summary
Returns Beta
Icon
Beta has not been calculated since enough price history is not available
stock-summaryNews & Corporate Actions

News

Why is Secmark Consultancy Ltd falling/rising?

Recent Price Movement and Market Performance

Secmark Consultancy Ltd’s share price has been under pressure over the past week, declining by 10.84%, significantly underperforming the Sensex benchmark which fell by only 2.45% in the same period. The stock’s one-month return also shows a negative trend at -6.05%, compared to the Sensex’s modest decline of 0.61%. Year-to-date, the stock has dropped 2.65%, slightly worse than the Sensex’s 1.71% fall. Although the stock has managed a marginal positive return of 0.70% over the past year, this pales in comparison to the Sensex’s robust 9.17% gain.

On the day in question, the stock opened with a gain of 2.7% and reached an intraday high of ₹119.75, but subsequently declined sharply to touch a low of ₹108.01, marking a wide trad...

Read full news article
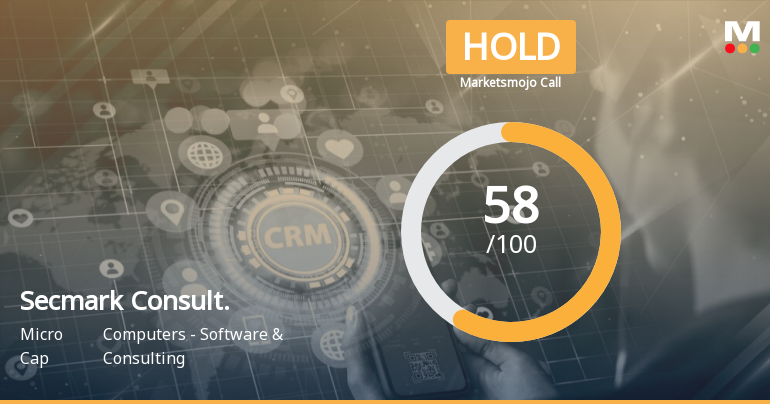
Announcements stock-summary

Icon
No announcement available

Corporate Actions stock-summary

stock-summary
BOARD MEETING

No Upcoming Board Meetings

stock-summary
DIVIDEND

No Dividend history available

stock-summary
SPLITS

No Splits history available

stock-summary
BONUS

Secmark Consultancy Ltd has announced 3:2 bonus issue, ex-date: 12 Oct 22

stock-summary
RIGHTS

No Rights history available

stock-summaryKey Factors

Quality key factors stock-summary

Factor
Value
Sales Growth (5y)
36.53%
EBIT Growth (5y)
59.11%
EBIT to Interest (avg)
-0.28
Debt to EBITDA (avg)
1.15
Net Debt to Equity (avg)
-0.88
Sales to Capital Employed (avg)
1.07
Tax Ratio
25.57%
Dividend Payout Ratio
0
Pledged Shares
0
Institutional Holding
0
ROCE (avg)
24.05%
ROE (avg)
16.36%

Valuation key factors

Factor
Value
P/E Ratio
29
Industry P/E
0
Price to Book Value
5.48
EV to EBIT
21.63
EV to EBITDA
11.13
EV to Capital Employed
39.57
EV to Sales
2.60
PEG Ratio
0.43
Dividend Yield
NA
ROCE (Latest)
182.92%
ROE (Latest)
18.76%

Technicals key factors

Indicator
Weekly
Monthly
MACD
Bearish
Mildly Bearish
RSI
No Signal
Bearish
Bollinger Bands
Bearish
Bearish
Moving Averages
Bearish (Daily)
KST
Mildly Bullish
Bullish
Dow Theory
Mildly Bearish
No Trend
OBV
Mildly Bearish
Bullish
stock-summary Technical Indicator Scale: Bearish, Mildly Bearish, Sideways, Mildly Bullish, Bullish  Turned 
stock-summaryShareholding
Shareholding Snapshot : Sep 2025stock-summary
Shareholding Compare (%holding) stock-summary
Majority shareholders

Promoters

Pledged Promoter Holdings

None

Mutual Funds

Held by 0 Schemes

FIIs

Held by 0 FIIs

Promoter with highest holding

Secmark Holdings Private Limited (72.03%)

Highest Public shareholder

Bp Wealth Management Private Limited (4.02%)

Individual Investors Holdings

17.86%

stock-summaryFinancial
[
  {
    "link": "quarterly",
    "btn_text": "All Quarterly Results",
    "header": "Quarterly Results Snapshot (Consolidated) - Sep'25 - QoQ",
    "rhs": [
      {
        "prefix": "Net Sales ",
        "suffix": "QoQ Growth in quarter ended Sep 2025 is 40.30% vs -46.80% in Jun 2025",
        "dir": 1
      },
      {
        "prefix": "Consolidated Net Profit ",
        "suffix": "QoQ Growth in quarter ended Sep 2025 is 195.56% vs -122.90% in Jun 2025",
        "dir": 1
      }
    ],
    "table": {
      "header": [
        "Sep'25",
        "Jun'25",
        "Change(%)"
      ],
      "body": [
        {
          "field": "Net Sales",
          "val1": "9.33",
          "val2": "6.65",
          "chgp": "40.30%",
          "chgp_class": "positive"
        },
        {
          "field": "Operating Profit (PBDIT) excl Other Income",
          "val1": "1.96",
          "val2": "-0.38",
          "chgp": "615.79%",
          "chgp_class": "positive"
        },
        {
          "field": "Interest",
          "val1": "0.01",
          "val2": "0.06",
          "chgp": "-83.33%",
          "chgp_class": "positive"
        },
        {
          "field": "Exceptional Items",
          "val1": "0.00",
          "val2": "0.00",
          "chgp": "",
          "chgp_class": "neutral"
        },
        {
          "field": "Consolidate Net Profit",
          "val1": "0.86",
          "val2": "-0.90",
          "chgp": "195.56%",
          "chgp_class": "positive"
        },
        {
          "field": "Operating Profit Margin (Excl OI)",
          "val1": "21.01%",
          "val2": "-5.71%",
          "chgp": "26.72%",
          "chgp_class": "positive"
        }
      ]
    }
  },
  {
    "link": "half-yearly",
    "btn_text": "All Half Yearly Results",
    "header": "Half Yearly Results Snapshot (Consolidated) - Sep'25",
    "rhs": [
      {
        "prefix": "Net Sales ",
        "suffix": " Growth in half year ended Sep 2025 is 9.37% vs 35.00% in Sep 2024",
        "dir": -1
      },
      {
        "prefix": "Consolidated Net Profit ",
        "suffix": " Growth in half year ended Sep 2025 is -110.81% vs 108.47% in Sep 2024",
        "dir": -1
      }
    ],
    "table": {
      "header": [
        "Sep'25",
        "Sep'24",
        "Change(%)"
      ],
      "body": [
        {
          "field": "Net Sales",
          "val1": "15.99",
          "val2": "14.62",
          "chgp": "9.37%",
          "chgp_class": "positive"
        },
        {
          "field": "Operating Profit (PBDIT) excl Other Income",
          "val1": "1.59",
          "val2": "2.37",
          "chgp": "-32.91%",
          "chgp_class": "negative"
        },
        {
          "field": "Interest",
          "val1": "0.07",
          "val2": "0.26",
          "chgp": "-73.08%",
          "chgp_class": "positive"
        },
        {
          "field": "Exceptional Items",
          "val1": "0.00",
          "val2": "0.00",
          "chgp": "",
          "chgp_class": "neutral"
        },
        {
          "field": "Consolidate Net Profit",
          "val1": "-0.04",
          "val2": "0.37",
          "chgp": "-110.81%",
          "chgp_class": "negative"
        },
        {
          "field": "Operating Profit Margin (Excl OI)",
          "val1": "9.94%",
          "val2": "16.21%",
          "chgp": "-6.27%",
          "chgp_class": "negative"
        }
      ]
    }
  },
  {
    "link": "nine-monthly",
    "btn_text": "All Nine Monthly Results",
    "header": "Nine Monthly Results Snapshot (Consolidated) - Dec'24",
    "rhs": [
      {
        "prefix": "Net Sales ",
        "suffix": "YoY Growth in nine months ended Dec 2024 is 30.75% vs 53.50% in Dec 2023",
        "dir": -1
      },
      {
        "prefix": "Consolidated Net Profit ",
        "suffix": "YoY Growth in nine months ended Dec 2024 is 108.28% vs 15.70% in Dec 2023",
        "dir": 1
      }
    ],
    "table": {
      "header": [
        "Dec'24",
        "Dec'23",
        "Change(%)"
      ],
      "body": [
        {
          "field": "Net Sales",
          "val1": "22.62",
          "val2": "17.30",
          "chgp": "30.75%",
          "chgp_class": "positive"
        },
        {
          "field": "Operating Profit (PBDIT) excl Other Income",
          "val1": "3.22",
          "val2": "-2.18",
          "chgp": "247.71%",
          "chgp_class": "positive"
        },
        {
          "field": "Interest",
          "val1": "0.35",
          "val2": "0.81",
          "chgp": "-56.79%",
          "chgp_class": "positive"
        },
        {
          "field": "Exceptional Items",
          "val1": "0.00",
          "val2": "0.00",
          "chgp": "",
          "chgp_class": "neutral"
        },
        {
          "field": "Consolidate Net Profit",
          "val1": "0.36",
          "val2": "-4.35",
          "chgp": "108.28%",
          "chgp_class": "positive"
        },
        {
          "field": "Operating Profit Margin (Excl OI)",
          "val1": "14.24%",
          "val2": "-12.60%",
          "chgp": "26.84%",
          "chgp_class": "positive"
        }
      ]
    }
  },
  {
    "link": "annual",
    "btn_text": "All Annual Results",
    "header": "Annual Results Snapshot (Consolidated) - Mar'25",
    "rhs": [
      {
        "prefix": "Net Sales ",
        "suffix": "YoY Growth in year ended Mar 2025 is 42.78% vs 41.00% in Mar 2024",
        "dir": 1
      },
      {
        "prefix": "Consolidated Net Profit ",
        "suffix": "YoY Growth in year ended Mar 2025 is 276.54% vs 53.45% in Mar 2024",
        "dir": 1
      }
    ],
    "table": {
      "header": [
        "Mar'25",
        "Mar'24",
        "Change(%)"
      ],
      "body": [
        {
          "field": "Net Sales",
          "val1": "35.11",
          "val2": "24.59",
          "chgp": "42.78%",
          "chgp_class": "positive"
        },
        {
          "field": "Operating Profit (PBDIT) excl Other Income",
          "val1": "9.31",
          "val2": "1.23",
          "chgp": "656.91%",
          "chgp_class": "positive"
        },
        {
          "field": "Interest",
          "val1": "0.39",
          "val2": "1.04",
          "chgp": "-62.50%",
          "chgp_class": "positive"
        },
        {
          "field": "Exceptional Items",
          "val1": "0.00",
          "val2": "0.00",
          "chgp": "",
          "chgp_class": "neutral"
        },
        {
          "field": "Consolidate Net Profit",
          "val1": "4.29",
          "val2": "-2.43",
          "chgp": "276.54%",
          "chgp_class": "positive"
        },
        {
          "field": "Operating Profit Margin (Excl OI)",
          "val1": "26.52%",
          "val2": "5.00%",
          "chgp": "21.52%",
          "chgp_class": "positive"
        }
      ]
    }
  }
]

Quarterly Results Snapshot (Consolidated) - Sep'25 - QoQstock-summary

Sep'25
Jun'25
Change(%)
Net Sales
9.33
6.65
40.30%
Operating Profit (PBDIT) excl Other Income
1.96
-0.38
615.79%
Interest
0.01
0.06
-83.33%
Exceptional Items
0.00
0.00
Consolidate Net Profit
0.86
-0.90
195.56%
Operating Profit Margin (Excl OI)
21.01%
-5.71%
26.72%
Values in Rs Cr.
Direction Arrows
Net Sales

QoQ Growth in quarter ended Sep 2025 is 40.30% vs -46.80% in Jun 2025

Direction Arrows
Consolidated Net Profit

QoQ Growth in quarter ended Sep 2025 is 195.56% vs -122.90% in Jun 2025

Half Yearly Results Snapshot (Consolidated) - Sep'25stock-summary

Sep'25
Sep'24
Change(%)
Net Sales
15.99
14.62
9.37%
Operating Profit (PBDIT) excl Other Income
1.59
2.37
-32.91%
Interest
0.07
0.26
-73.08%
Exceptional Items
0.00
0.00
Consolidate Net Profit
-0.04
0.37
-110.81%
Operating Profit Margin (Excl OI)
9.94%
16.21%
-6.27%
Values in Rs Cr.
Direction Arrows
Net Sales

Growth in half year ended Sep 2025 is 9.37% vs 35.00% in Sep 2024

Direction Arrows
Consolidated Net Profit

Growth in half year ended Sep 2025 is -110.81% vs 108.47% in Sep 2024

Nine Monthly Results Snapshot (Consolidated) - Dec'24stock-summary

Dec'24
Dec'23
Change(%)
Net Sales
22.62
17.30
30.75%
Operating Profit (PBDIT) excl Other Income
3.22
-2.18
247.71%
Interest
0.35
0.81
-56.79%
Exceptional Items
0.00
0.00
Consolidate Net Profit
0.36
-4.35
108.28%
Operating Profit Margin (Excl OI)
14.24%
-12.60%
26.84%
Values in Rs Cr.
Direction Arrows
Net Sales

YoY Growth in nine months ended Dec 2024 is 30.75% vs 53.50% in Dec 2023

Direction Arrows
Consolidated Net Profit

YoY Growth in nine months ended Dec 2024 is 108.28% vs 15.70% in Dec 2023

Annual Results Snapshot (Consolidated) - Mar'25stock-summary

Mar'25
Mar'24
Change(%)
Net Sales
35.11
24.59
42.78%
Operating Profit (PBDIT) excl Other Income
9.31
1.23
656.91%
Interest
0.39
1.04
-62.50%
Exceptional Items
0.00
0.00
Consolidate Net Profit
4.29
-2.43
276.54%
Operating Profit Margin (Excl OI)
26.52%
5.00%
21.52%
Values in Rs Cr.
Direction Arrows
Net Sales

YoY Growth in year ended Mar 2025 is 42.78% vs 41.00% in Mar 2024

Direction Arrows
Consolidated Net Profit

YoY Growth in year ended Mar 2025 is 276.54% vs 53.45% in Mar 2024

stock-summaryCompany CV
About Secmark Consultancy Ltd stock-summary
stock-summary
Secmark Consultancy Ltd
Micro Cap
Computers - Software & Consulting
Secmark Consultancy Limited was originally incorporated as a Private Limited Company on August 03, 2011 with the Registrar of Companies, Mumbai. Subsequently, the Company was converted into Public Limited Company w.e.f. March 02, 2020. The Company is engaged in the providing Consulting, IT Services, Outsourcing and business solutions to organization in areas of Compliance, Operations, Risk Management and Legal Matters to financial market participants.
Company Coordinates stock-summary
Icon
No Company Details Available