
Compare Seshaasai Tech. with Similar Stocks
Dashboard
High Management Efficiency with a high ROE of 0%
Strong ability to service debt as the company has a low Debt to EBITDA ratio of 0.22 times
Poor long term growth as Net Sales has grown by an annual rate of 0% over the last 5 years
Positive results in Mar 26
With ROE of 17, it has a Very Expensive valuation with a 4.5 Price to Book Value
Falling Participation by Institutional Investors
Stock DNA
Computers - Software & Consulting
INR 6,418 Cr (Small Cap)
27.00
21
0.00%
-0.23
17.05%
4.53
Total Returns (Price + Dividend) 
Seshaasai Tech. for the last several years.
Risk Adjusted Returns v/s
Returns Beta

News
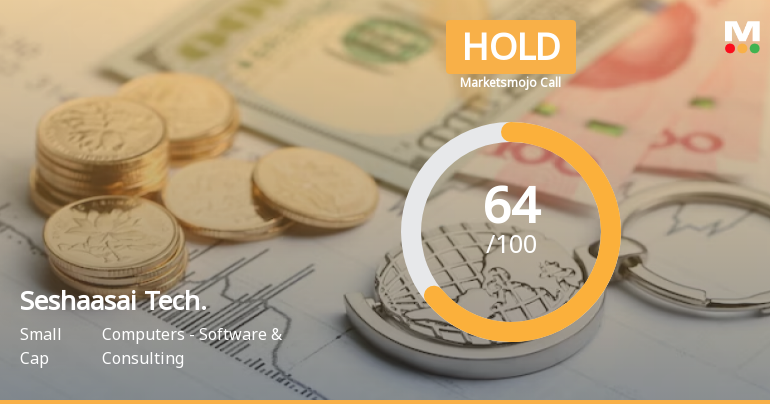
Seshaasai Technologies Ltd is Rated Hold
Seshaasai Technologies Ltd is rated 'Hold' by MarketsMOJO, with this rating last updated on 04 May 2026. However, the analysis and financial metrics presented here reflect the stock's current position as of 18 July 2026, providing investors with an up-to-date view of the company’s fundamentals, returns, and market standing.
Read full news article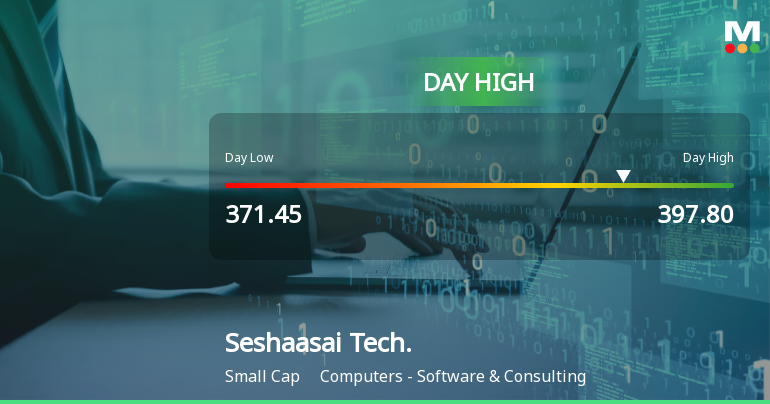
Seshaasai Technologies Ltd Surges 7.2% to Day's High of Rs 394 — Outperforms Sector by 7.45 Percentage Points
The Sensex declined by 0.73% on 14 Jul 2026, yet Seshaasai Technologies Ltd surged 7.2%, reaching an intraday high of Rs 394. This 7.45-percentage-point outperformance over its sector underscores a distinctly stock-specific rally rather than a market-wide uplift.
Read full news article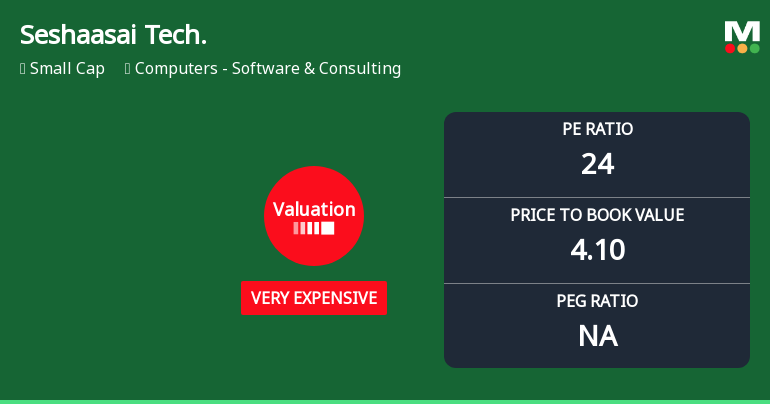
Seshaasai Technologies Ltd Valuation Shifts Signal Price Attractiveness Change
Seshaasai Technologies Ltd, a player in the Computers - Software & Consulting sector, has witnessed a notable shift in its valuation parameters, moving from an expensive to a very expensive rating. This change, coupled with a recent upgrade in its Mojo Grade from Sell to Hold, reflects evolving market perceptions and raises questions about the stock’s price attractiveness amid strong operational metrics and sector dynamics.
Read full news article Announcements
Compliances-Certificate under Reg. 74 (5) of SEBI (DP) Regulations 2018
14-Jul-2026 | Source : BSECertificate under Reg 74(5) of SEBI (DP) Regulations 2018
Closure of Trading Window
25-Jun-2026 | Source : BSEPlease find enclosed herewith the intimation of Trading Window closure
Announcement under Regulation 30 (LODR)-Analyst / Investor Meet - Intimation
10-Jun-2026 | Source : BSEPlease find enclosed herewith Schedule of Conference Meeting
Corporate Actions

No Upcoming Board Meetings

No Dividend history available

No Splits history available

No Bonus history available

No Rights history available
Quality key factors
Valuation key factors
Technicals key factors
 Technical Indicator Scale: Bearish, Mildly Bearish, Sideways, Mildly Bullish, Bullish Turned
 Shareholding Snapshot : Mar 2026
Shareholding Compare (%holding)
Promoters
None
Held by 12 Schemes (4.15%)
Held by 9 FIIs (0.32%)
Gautam Sampatraj Jain (40.9%)
Florintree Nextech Llp (4.07%)
5.11%
Quarterly Results Snapshot (Standalone) - Mar'26 - QoQ

QoQ Growth in quarter ended Mar 2026 is 7.98% vs 6.51% in Dec 2025
QoQ Growth in quarter ended Mar 2026 is 23.95% vs 15.08% in Dec 2025
Half Yearly Results Snapshot (Standalone) - Sep'25
Not Applicable: The company has declared_date for only one period
Not Applicable: The company has declared_date for only one period
Nine Monthly Results Snapshot (Standalone) - Dec'25
Not Applicable: The company has declared_date for only one period
Not Applicable: The company has declared_date for only one period
Annual Results Snapshot (Consolidated) - Mar'26
YoY Growth in year ended Mar 2026 is -1.50% vs -6.10% in Mar 2025

YoY Growth in year ended Mar 2026 is 7.96% vs 31.33% in Mar 2025
About Seshaasai Technologies Ltd

Company Coordinates


