
Compare Shadowfax Techno with Similar Stocks
Dashboard
Poor Management Efficiency with a low ROE of 0%
- The company has reported losses. Due to this company has reported negative ROE
The company is Net-Debt Free
Healthy long term growth as Net Sales has grown by an annual rate of 0% and Operating profit at 0%
With ROE of 6.6, it has a Very Expensive valuation with a 7.5 Price to Book Value
Stock DNA
Transport Services
INR 13,403 Cr (Mid Cap)
140.00
35
0.00%
-0.45
6.59%
7.33
Total Returns (Price + Dividend) 
Shadowfax Techno for the last several years.
Risk Adjusted Returns v/s
Returns Beta

News
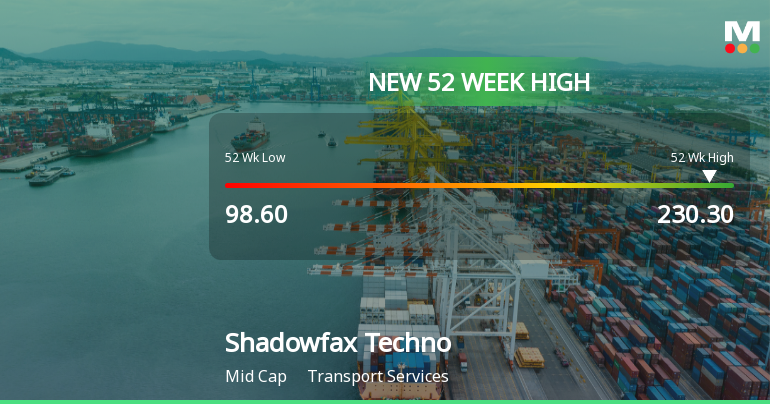
Broad-Based Technical Strength Lifts Shadowfax Technologies Ltd to 52-Week High of Rs 230
Trading at an intraday peak of Rs 230 on 15 Jun 2026, Shadowfax Technologies Ltd has surged to a fresh 52-week and all-time high, propelled by a confluence of positive technical signals and sustained price momentum.
Read full news article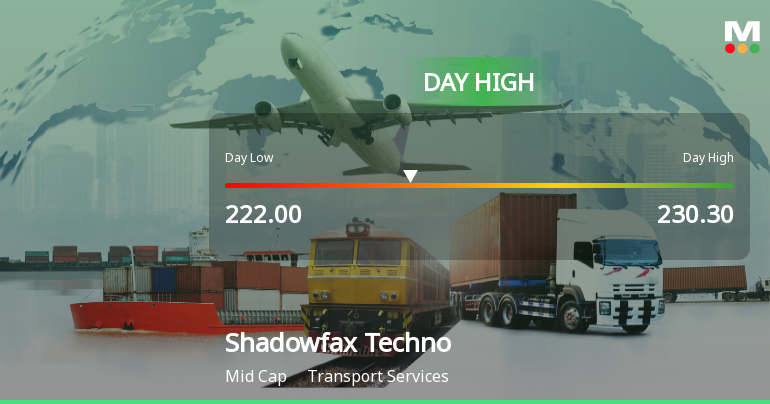
Shadowfax Technologies Ltd Surges 5.07% to Day's High of Rs 230 — Outperforms Sector by 2.37 Percentage Points
The Sensex advanced 1.45% on 15 Jun 2026, yet Shadowfax Technologies Ltd outpaced the broader market with a 5.07% gain, touching an intraday high of Rs 230. This 2.37-percentage-point outperformance over its Transport Services sector peers signals a distinctly stock-specific momentum shift rather than a mere market tailwind.
Read full news article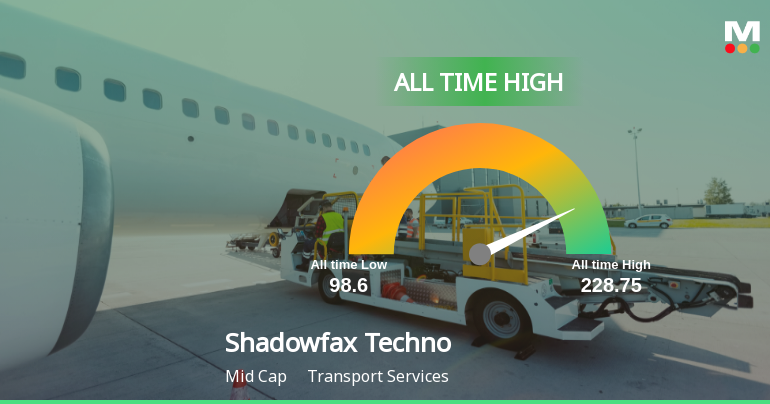
Shadowfax Technologies Ltd Hits All-Time High of Rs 228.75 as Momentum Builds Across Timeframes
Extending its recent rally, Shadowfax Technologies Ltd surged to a fresh all-time high of Rs 228.75 on 15 Jun 2026, outperforming both its sector and the broader Sensex with a 4.54% gain on the day.
Read full news article Announcements
Announcement under Regulation 30 (LODR)-Allotment of ESOP / ESPS
04-Jun-2026 | Source : BSEAllotment of 227955 Equity Shares of Rs. 10/- each to the eligible employees/ESOP holders
Announcement under Regulation 30 (LODR)-Analyst / Investor Meet - Intimation
03-Jun-2026 | Source : BSEShadowfax Technologies Limited has informed the Exchange about Schedule of Investors Conference / Analyst Meet
Announcement under Regulation 30 (LODR)-Analyst / Investor Meet - Intimation
03-Jun-2026 | Source : BSEShadowfax Technologies Limited has informed the Exchange about Schedule of Investors Conference / Analyst Meet
Corporate Actions

No Upcoming Board Meetings

No Dividend history available

No Splits history available

No Bonus history available

No Rights history available
Quality key factors
Valuation key factors
Technicals key factors
 Technical Indicator Scale: Bearish, Mildly Bearish, Sideways, Mildly Bullish, Bullish Turned
 Shareholding Snapshot : Mar 2026
Shareholding Compare (%holding)
Non Institution
None
Held by 10 Schemes (12.49%)
Held by 27 FIIs (7.65%)
Abhishek Bansal (9.33%)
Newquest Asia Fund Iv Singapore Pte Ltd (11.59%)
7.81%
Quarterly Results Snapshot (Standalone) - Mar'26 - QoQ

QoQ Growth in quarter ended Mar 2026 is 6.88% vs 18.69% in Dec 2025
QoQ Growth in quarter ended Mar 2026 is 51.30% vs 156.71% in Dec 2025
Half Yearly Results Snapshot (Consolidated) - Sep'25
Not Applicable: The company has declared_date for only one period
Not Applicable: The company has declared_date for only one period
Nine Monthly Results Snapshot (Consolidated) - Dec'25
Not Applicable: The company has declared_date for only one period
Not Applicable: The company has declared_date for only one period
Annual Results Snapshot (Consolidated) - Mar'26

YoY Growth in year ended Mar 2026 is 69.10% vs 31.85% in Mar 2025
YoY Growth in year ended Mar 2026 is 1,637.33% vs 154.12% in Mar 2025
About Shadowfax Technologies Ltd

Company Coordinates


