
Compare Shivalik Rasayan with Similar Stocks
Dashboard
Poor Management Efficiency with a low ROE of 4.26%
- The company has been able to generate a Return on Equity (avg) of 4.26% signifying low profitability per unit of shareholders funds
Poor long term growth as Operating profit has grown by an annual rate -1.67% of over the last 5 years
Flat results in Mar 26
Consistent Underperformance against the benchmark over the last 3 years
Stock DNA
Pesticides & Agrochemicals
INR 351 Cr (Micro Cap)
31.00
41
0.21%
0.13
1.98%
0.61
Total Returns (Price + Dividend) 
Latest dividend: 0.5 per share ex-dividend date: Sep-19-2025
Risk Adjusted Returns v/s
Returns Beta

News
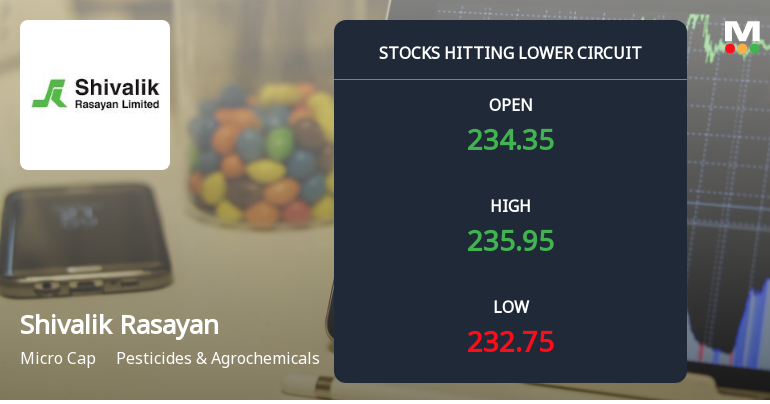
Shivalik Rasayan Ltd Locks at Lower Circuit With 5.0% Loss — Sellers Queue, No Buyers in Sight
At Rs 227.85, sellers were still queuing — but there were no buyers willing to take the other side. Shivalik Rasayan Ltd locked at its lower circuit of 5.0% on 11 Jun 2026, with unfilled sell orders and a frozen price, reflecting persistent selling pressure in a micro-cap stock with limited liquidity.
Read full news article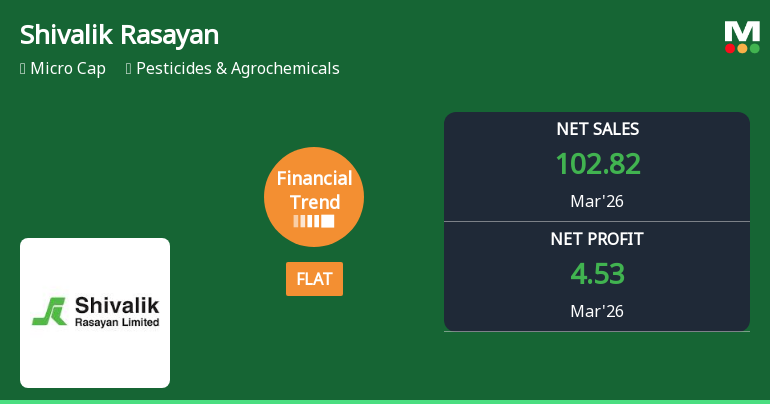
Shivalik Rasayan Ltd Reports Mixed Quarterly Results Amidst Negative Financial Trend
Shivalik Rasayan Ltd, a micro-cap player in the Pesticides & Agrochemicals sector, has posted its highest quarterly revenue and profit figures in the March 2026 quarter, signalling operational strength despite a recent shift in its overall financial trend from flat to negative. However, key profitability metrics and returns on capital continue to lag, reflecting ongoing challenges for the company amid a tough market environment.
Read full news article
Shivalik Rasayan Ltd is Rated Sell
Shivalik Rasayan Ltd is rated 'Sell' by MarketsMOJO, with this rating last updated on 25 May 2026. However, the analysis and financial metrics presented here reflect the stock's current position as of 10 June 2026, providing investors with the latest insights into its performance and outlook.
Read full news article Announcements
Announcement under Regulation 30 (LODR)-Trading Plan under SEBI (PIT) Regulations 2015
04-Jun-2026 | Source : BSEintimation as per regulation 7(3) of the SEBI PIT Regulations 2015
Results For The Quarter And Year Ended On 31.03.2026
27-May-2026 | Source : BSEWe wish to inform you that the Board of Directors of the Company approved the financial results for the quarter and year ended on 31.03.2026
Board Meeting Outcome for Outcome Of Board Meeting
27-May-2026 | Source : BSEWe wish to inform that the Board approved the Audited Financial Results (Standalone & Consolidated) for the quarter and year ended on 31.03.2026
Corporate Actions

No Upcoming Board Meetings

Shivalik Rasayan Ltd has declared 10% dividend, ex-date: 19 Sep 25

Shivalik Rasayan Ltd has announced 5:10 stock split, ex-date: 19 Apr 18

Shivalik Rasayan Ltd has announced 1:4 bonus issue, ex-date: 19 Apr 18

No Rights history available
Quality key factors
Valuation key factors
Technicals key factors
 Technical Indicator Scale: Bearish, Mildly Bearish, Sideways, Mildly Bullish, Bullish Turned
 Shareholding Snapshot : Mar 2026
Shareholding Compare (%holding)
Non Institution
None
Held by 0 Schemes
Held by 11 FIIs (4.2%)
Growel Remedies Limited (47.37%)
Ginnerup Capital Aps (3.22%)
31.84%
Quarterly Results Snapshot (Consolidated) - Mar'26 - YoY

YoY Growth in quarter ended Mar 2026 is 48.18% vs -2.58% in Mar 2025

YoY Growth in quarter ended Mar 2026 is 9.69% vs 20.06% in Mar 2025
Half Yearly Results Snapshot (Consolidated) - Sep'25
Growth in half year ended Sep 2025 is 16.60% vs 19.44% in Sep 2024
Growth in half year ended Sep 2025 is -34.79% vs 24.26% in Sep 2024
Nine Monthly Results Snapshot (Consolidated) - Dec'25
YoY Growth in nine months ended Dec 2025 is 9.41% vs 20.14% in Dec 2024
YoY Growth in nine months ended Dec 2025 is -40.55% vs 40.35% in Dec 2024
Annual Results Snapshot (Consolidated) - Mar'26
YoY Growth in year ended Mar 2026 is 18.04% vs 14.21% in Mar 2025
YoY Growth in year ended Mar 2026 is -27.31% vs 2.08% in Mar 2025
About Shivalik Rasayan Ltd

Company Coordinates


