
Compare Shoppers Stop with Similar Stocks
Stock DNA
Diversified Retail
INR 3,989 Cr (Small Cap)
NA (Loss Making)
77
0.00%
11.35
-6.97%
13.80
Total Returns (Price + Dividend) 
Latest dividend: 0.75 per share ex-dividend date: Jul-22-2019
Risk Adjusted Returns v/s
Returns Beta

News
Shoppers Stop Ltd is Rated Strong Sell
Shoppers Stop Ltd is rated Strong Sell by MarketsMOJO. This rating was last updated on 16 February 2026, reflecting a reassessment of the stock’s outlook. However, the analysis and financial metrics discussed below are based on the company’s current position as of 20 June 2026, providing investors with the latest insights into its performance and prospects.
Read full news article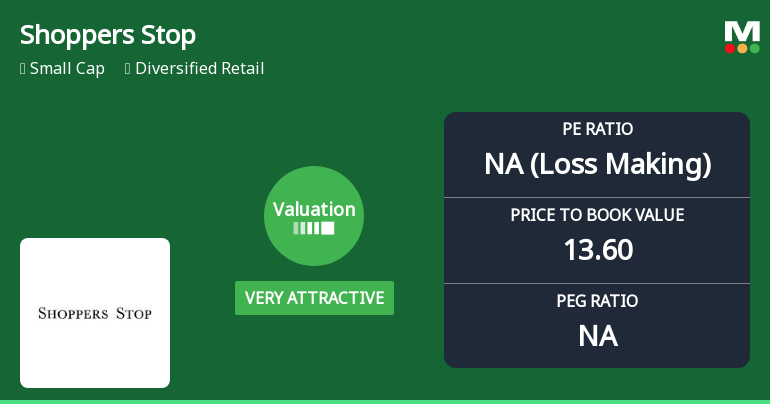
Shoppers Stop Ltd Valuation Turns Very Attractive Amid Mixed Market Returns
Shoppers Stop Ltd, a key player in the diversified retail sector, has seen its valuation parameters shift markedly, with its price-to-earnings (P/E) and price-to-book value (P/BV) ratios moving into the 'very attractive' category. Despite this, the company’s financial performance and market returns present a complex picture, prompting a reassessment of its investment appeal relative to peers and historical benchmarks.
Read full news article
Shoppers Stop Ltd is Rated Strong Sell
Shoppers Stop Ltd is rated Strong Sell by MarketsMOJO, with this rating last updated on 16 February 2026. However, the analysis and financial metrics presented here reflect the stock’s current position as of 09 June 2026, providing investors with the latest insights into the company’s performance and outlook.
Read full news article Announcements
Announcement under Regulation 30 (LODR)-Credit Rating
05-Jun-2026 | Source : BSEPlease find attached disclosure
Compliances-Reg.24(A)-Annual Secretarial Compliance
26-May-2026 | Source : BSEPlease find attached disclosure
Announcement under Regulation 30 (LODR)-Newspaper Publication
21-May-2026 | Source : BSEPlease find attached disclosure
Corporate Actions

No Upcoming Board Meetings

Shoppers Stop Ltd has declared 15% dividend, ex-date: 22 Jul 19

Shoppers Stop Ltd has announced 5:10 stock split, ex-date: 12 Jan 11

No Bonus history available

Shoppers Stop Ltd has announced 17:70 rights issue, ex-date: 19 Nov 20
Quality key factors
Valuation key factors
Technicals key factors
 Technical Indicator Scale: Bearish, Mildly Bearish, Sideways, Mildly Bullish, Bullish Turned
 Shareholding Snapshot : Mar 2026
Shareholding Compare (%holding)
Promoters
9.7283
Held by 7 Schemes (22.14%)
Held by 36 FIIs (2.05%)
Anbee Constructions Llp (12.13%)
Hdfc Small Cap Fund (8.73%)
3.94%
Quarterly Results Snapshot (Consolidated) - Mar'26 - QoQ

QoQ Growth in quarter ended Mar 2026 is -14.55% vs 12.67% in Dec 2025
QoQ Growth in quarter ended Mar 2026 is -201.43% vs 180.16% in Dec 2025
Half Yearly Results Snapshot (Consolidated) - Sep'25

Growth in half year ended Sep 2025 is 10.69% vs 7.45% in Sep 2024
Growth in half year ended Sep 2025 is 17.25% vs -351.51% in Sep 2024
Nine Monthly Results Snapshot (Consolidated) - Dec'25
YoY Growth in nine months ended Dec 2025 is 7.57% vs 8.97% in Dec 2024
YoY Growth in nine months ended Dec 2025 is -321.08% vs -83.50% in Dec 2024
Annual Results Snapshot (Consolidated) - Mar'26
YoY Growth in year ended Mar 2026 is 8.98% vs 7.21% in Mar 2025
YoY Growth in year ended Mar 2026 is -431.40% vs -85.90% in Mar 2025
About Shoppers Stop Ltd

Company Coordinates


