
Compare Shrydus Indust. with Similar Stocks
Stock DNA
Non Banking Financial Company (NBFC)
INR 10 Cr (Micro Cap)
1.00
21
0.00%
0.00
6.47%
0.24
Total Returns (Price + Dividend) 
Shrydus Indust. for the last several years.
Risk Adjusted Returns v/s
Returns Beta

News
Are Shrydus Industries Ltd latest results good or bad?
Shrydus Industries Ltd's latest financial results for Q4 FY26 reveal significant operational challenges. The company reported net sales of ₹0.00 crores, marking a complete absence of revenue generation during the quarter. This follows a brief period of minimal sales in the previous quarter (Q3 FY26), where net sales were ₹0.20 crores. The net profit for Q4 FY26 was a loss of ₹0.02 crores, which represents a notable decline from the previous quarter's performance. The data indicates that Shrydus Industries has recorded zero revenue in five out of the last seven quarters, raising substantial concerns regarding the sustainability of its business model. The erratic revenue pattern suggests that the company may be operating on a project-based or one-off transaction model rather than establishing a stable, recurring revenue stream. Despite these challenges, the company maintains a relatively strong balance shee...
Read full news article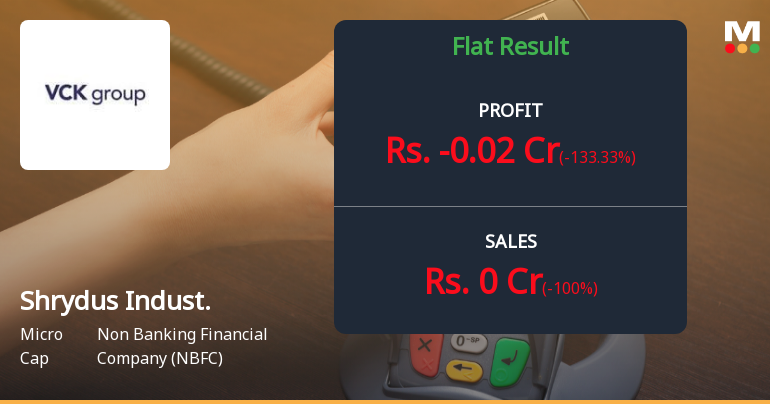
Shrydus Industries Q4 FY26: Microcap NBFC Posts Loss Amid Revenue Collapse
Shrydus Industries Limited, a Kolkata-based microcap non-banking financial company, reported a net loss of ₹0.02 crores for Q4 FY26, marking a dramatic reversal from the ₹0.06 crores profit posted in Q3 FY26. The ₹11.00 crore market capitalisation company witnessed a complete revenue collapse during the quarter, with net sales plunging to zero from ₹0.20 crores in the preceding quarter—a sequential decline of 100.00%. The stock, trading at ₹3.53 on May 22, 2026, has declined 40.17% over the past year, significantly underperforming the NBFC sector's 8.06% gain and reflecting mounting investor concerns about the company's operational sustainability.
Read full news article
Shrydus Industries Ltd Upgraded to Sell on Technical Improvements Despite Weak Fundamentals
Shrydus Industries Ltd, a micro-cap player in the Non Banking Financial Company (NBFC) sector, has seen its investment rating upgraded from Strong Sell to Sell as of 8 April 2026. This change reflects a nuanced shift in the company’s technical outlook amid persistent fundamental challenges and valuation considerations. The upgrade is primarily driven by improvements in technical indicators, while financial trends and quality metrics remain subdued.
Read full news article Announcements
Announcement under Regulation 30 (LODR)-Change in Management
03-Jun-2026 | Source : BSEIntimation for Appointment of Additional Director (Non Excutive Non Independent)
Compliances-Reg.24(A)-Annual Secretarial Compliance
27-May-2026 | Source : BSEAnnual Secretarial Compliance Report as per Reg. 24(A)
Announcement under Regulation 30 (LODR)-Newspaper Publication
25-May-2026 | Source : BSENewspaper Publication for Audited financial result for the quarter and year ended March 31 2026
Corporate Actions

No Upcoming Board Meetings

No Dividend history available

No Splits history available

No Bonus history available

Shrydus Industries Ltd has announced 5:3 rights issue, ex-date: 19 Jul 24
Quality key factors
Valuation key factors
Technicals key factors
 Technical Indicator Scale: Bearish, Mildly Bearish, Sideways, Mildly Bullish, Bullish Turned
 Shareholding Snapshot : Mar 2026
Shareholding Compare (%holding)
Non Institution
None
Held by 0 Schemes
Held by 0 FIIs
Shrey Premal Parekh (21.74%)
Vikash More (4.08%)
62.85%
Quarterly Results Snapshot (Consolidated) - Mar'26 - QoQ

QoQ Growth in quarter ended Mar 2026 is -100.00% vs 0.00% in Dec 2025
QoQ Growth in quarter ended Mar 2026 is -133.33% vs 400.00% in Dec 2025
Half Yearly Results Snapshot (Standalone) - Sep'25
Growth in half year ended Sep 2025 is -100.00% vs -6.82% in Sep 2024
Growth in half year ended Sep 2025 is -103.60% vs 1,058.33% in Sep 2024
Nine Monthly Results Snapshot (Standalone) - Dec'25
YoY Growth in nine months ended Dec 2025 is -95.57% vs -43.27% in Dec 2024
YoY Growth in nine months ended Dec 2025 is -101.48% vs 462.50% in Dec 2024
Annual Results Snapshot (Consolidated) - Mar'26
YoY Growth in year ended Mar 2026 is -99.50% vs 321.27% in Mar 2025
YoY Growth in year ended Mar 2026 is -100.60% vs 1,490.38% in Mar 2025
About Shrydus Industries Ltd

Company Coordinates


