
Compare Sigma Solve with Similar Stocks
Stock DNA
Computers - Software & Consulting
INR 410 Cr (Micro Cap)
17.00
NA
0.13%
-0.11
31.00%
5.28
Total Returns (Price + Dividend) 
Latest dividend: 0.5 per share ex-dividend date: Sep-10-2025
Risk Adjusted Returns v/s
Returns Beta

News
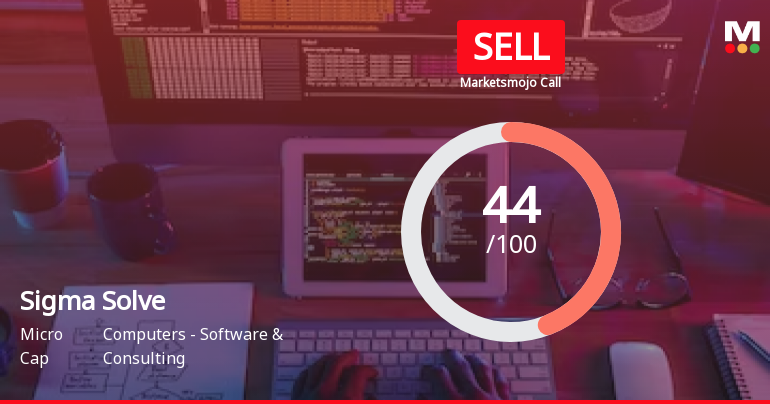
Sigma Solve Ltd is Rated Sell
Sigma Solve Ltd is rated Sell by MarketsMOJO, with this rating last updated on 20 May 2026. However, the analysis and financial metrics presented here reflect the company’s current position as of 12 June 2026, providing investors with the most up-to-date view of the stock’s fundamentals, returns, and technical outlook.
Read full news article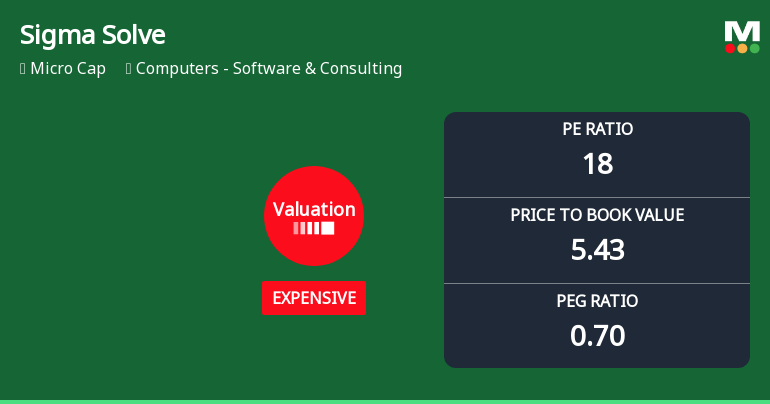
Sigma Solve Ltd Valuation Shifts Signal Price Attractiveness Challenges
Sigma Solve Ltd, a micro-cap player in the Computers - Software & Consulting sector, has seen its valuation parameters shift notably, moving from fair to expensive territory. This change, reflected in key metrics such as the price-to-earnings (P/E) and price-to-book value (P/BV) ratios, raises questions about the stock’s price attractiveness amid a challenging market backdrop and mixed returns relative to benchmarks like the Sensex.
Read full news article
Sigma Solve Ltd is Rated Sell
Sigma Solve Ltd is rated 'Sell' by MarketsMOJO, with this rating last updated on 20 May 2026. However, the analysis and financial metrics presented here reflect the stock's current position as of 01 June 2026, providing investors with an up-to-date view of the company’s performance and outlook.
Read full news article Announcements
Announcement under Regulation 30 (LODR)-Newspaper Publication
20-May-2026 | Source : BSESigma solve Limited Provide their Newspaper Publication of Financial result
Board Meeting Outcome for Outcome Of Board Meeting
19-May-2026 | Source : BSESigma solve Limited submit their Audited Financial result for the Quarter and Year Ended March 31 2026
Statement Of Deviation
19-May-2026 | Source : BSESigma solve Limited submit their Statement of Deviation for the quarter ended March 31 2026
Corporate Actions

No Upcoming Board Meetings

Sigma Solve Ltd has declared 5% dividend, ex-date: 10 Sep 25

Sigma Solve Ltd has announced 1:10 stock split, ex-date: 06 Oct 25

Sigma Solve Ltd has announced 3:2 bonus issue, ex-date: 07 Oct 22

No Rights history available
Quality key factors
Valuation key factors
Technicals key factors
 Technical Indicator Scale: Bearish, Mildly Bearish, Sideways, Mildly Bullish, Bullish Turned
 Shareholding Snapshot : Mar 2026
Shareholding Compare (%holding)
Promoters
None
Held by 0 Schemes
Held by 2 FIIs (0.0%)
Prakash Ratilal Parikh (20.8%)
Binaben Janakbhai Shah (4.12%)
21.95%
Quarterly Results Snapshot (Consolidated) - Mar'26 - QoQ

QoQ Growth in quarter ended Mar 2026 is -0.36% vs -3.36% in Dec 2025

QoQ Growth in quarter ended Mar 2026 is -19.73% vs 0.60% in Dec 2025
Half Yearly Results Snapshot (Consolidated) - Sep'25
Growth in half year ended Sep 2025 is 39.91% vs 1.41% in Sep 2024
Growth in half year ended Sep 2025 is 47.14% vs -14.65% in Sep 2024
Nine Monthly Results Snapshot (Consolidated) - Dec'25
YoY Growth in nine months ended Dec 2025 is 34.85% vs 7.78% in Dec 2024
YoY Growth in nine months ended Dec 2025 is 50.94% vs -12.42% in Dec 2024
Annual Results Snapshot (Consolidated) - Mar'26
YoY Growth in year ended Mar 2026 is 25.53% vs 17.09% in Mar 2025
YoY Growth in year ended Mar 2026 is 25.09% vs 18.28% in Mar 2025
About Sigma Solve Ltd

Company Coordinates


