

Key Events This Week
1 June: New 52-week high of Rs.424.5
1 June: Technical momentum upgrade to bullish
3 June: New 52-week high of Rs.425.25
4 June: Fresh 52-week high of Rs.425.7
5 June: Week closes at Rs.416.80 (-1.73% on day)
SIS Ltd Gains 0.94%: 2 Key Factors Driving the Week’s Momentum
Key Events This Week
8 June: Stock opens at Rs.405.60, down 2.69% amid broad market weakness
9 June: Valuation shifts to fair with P/E rising to 13.4; stock rebounds to Rs.421.10 (+3.82%)
11 June: New 52-week high of Rs.443 reached, closing at Rs.428.20 (+2.77%)
12 June: Week closes at Rs.420.70, down 1.75% on the day but up for the week
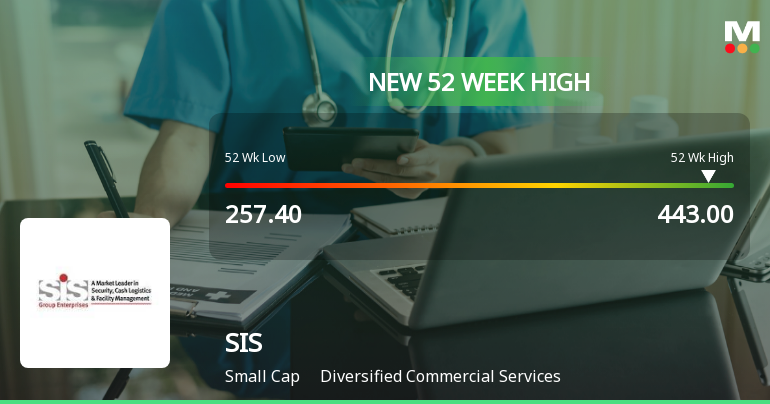
Broad-Based Technical Strength Lifts SIS Ltd to 52-Week High of Rs 443
With a decisive surge to Rs 443 on 11 Jun 2026, SIS Ltd has reached a fresh 52-week high, marking a significant milestone in its price momentum. This advance comes amid a backdrop of strong technical signals and sustained outperformance relative to its sector and the broader market.
Read full news article Announcements 
Business Responsibility and Sustainability Reporting (BRSR)
14-Jun-2026 | Source : BSESIS Limited has informed the Exchange regarding Business Responsibility and Sustainability Report for the Financial Year 2025-26
Announcement under Regulation 30 (LODR)-Newspaper Publication
14-Jun-2026 | Source : BSESIS Limited has informed the Exchange about Newspaper Advertisement published in English and Hindi Newspapers today i.e. June 14 2026 informing shareholders about the dispatch of Notice of 42nd Annual General Meeting and Annual Report for the Financial Year 2025-26.
Announcement under Regulation 30 (LODR)-Newspaper Publication
13-Jun-2026 | Source : BSESIS Limited has informed the Exchange about Newspaper Publication regarding 42nd Annual General Meeting scheduled to be held on July 6 2026 through Video Conferencing (VC)/Other Audio-Visual Means (OAVM).
Corporate Actions

No Upcoming Board Meetings

SIS Ltd has declared 140% dividend, ex-date: 06 Feb 26

SIS Ltd has announced 5:10 stock split, ex-date: 15 Jan 20

No Bonus history available

No Rights history available
Quality key factors
Valuation key factors
Technicals key factors
 Technical Indicator Scale: Bearish, Mildly Bearish, Sideways, Mildly Bullish, Bullish Turned
 Shareholding Snapshot : Mar 2026
Shareholding Compare (%holding)
Promoters
None
Held by 4 Schemes (6.16%)
Held by 86 FIIs (12.56%)
Ravindra Kishore Sinha (39.17%)
Fidelity Funds - Asian Smaller Companies Pool (4.57%)
5.33%
Quarterly Results Snapshot (Consolidated) - Mar'26 - YoY

YoY Growth in quarter ended Mar 2026 is 30.96% vs 9.25% in Mar 2025
YoY Growth in quarter ended Mar 2026 is 145.89% vs -1,813.97% in Mar 2025
Half Yearly Results Snapshot (Consolidated) - Sep'25
Growth in half year ended Sep 2025 is 14.20% vs 5.76% in Sep 2024
Growth in half year ended Sep 2025 is 30.56% vs -19.27% in Sep 2024
Nine Monthly Results Snapshot (Consolidated) - Dec'25
YoY Growth in nine months ended Dec 2025 is 17.73% vs 6.99% in Dec 2024

YoY Growth in nine months ended Dec 2025 is -84.98% vs 16.57% in Dec 2024
Annual Results Snapshot (Consolidated) - Mar'26
YoY Growth in year ended Mar 2026 is 21.17% vs 7.57% in Mar 2025
YoY Growth in year ended Mar 2026 is 1,068.87% vs -93.80% in Mar 2025
About SIS Ltd


