
Compare SJVN with Similar Stocks
Dashboard
Low ability to service debt as the company has a high Debt to EBITDA ratio of 9.64 times
- Poor long term growth as Net Sales has grown by an annual rate of 12.75% and Operating profit at 10.42% over the last 5 years
- Low ability to service debt as the company has a high Debt to EBITDA ratio of 9.64 times
- The company has been able to generate a Return on Equity (avg) of 6.74% signifying low profitability per unit of shareholders funds
Poor long term growth as Net Sales has grown by an annual rate of 12.75% and Operating profit at 10.42% over the last 5 years
With ROCE of 5.2, it has a Very Expensive valuation with a 1.3 Enterprise value to Capital Employed
Underperformed the market in the last 1 year
Total Returns (Price + Dividend) 
Latest dividend: 1.1 per share ex-dividend date: Feb-20-2026
Risk Adjusted Returns v/s
Returns Beta

News
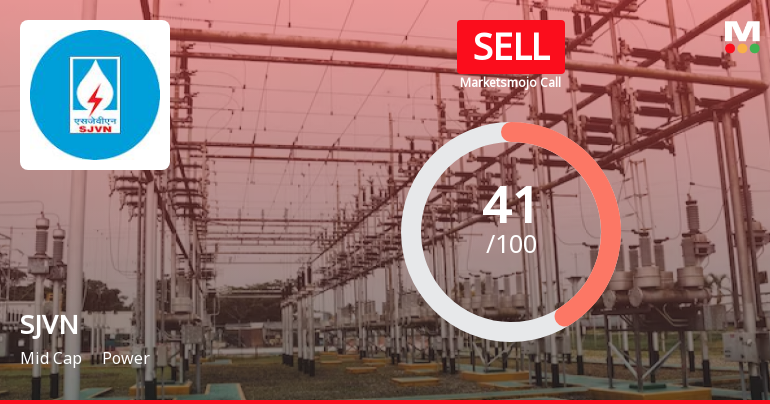
SJVN Ltd. is Rated Sell by MarketsMOJO
SJVN Ltd. is rated 'Sell' by MarketsMOJO, with this rating last updated on 11 Feb 2026. However, the analysis and financial metrics presented here reflect the stock's current position as of 24 June 2026, providing investors with an up-to-date view of the company’s fundamentals, valuation, financial trends, and technical outlook.
Read full news article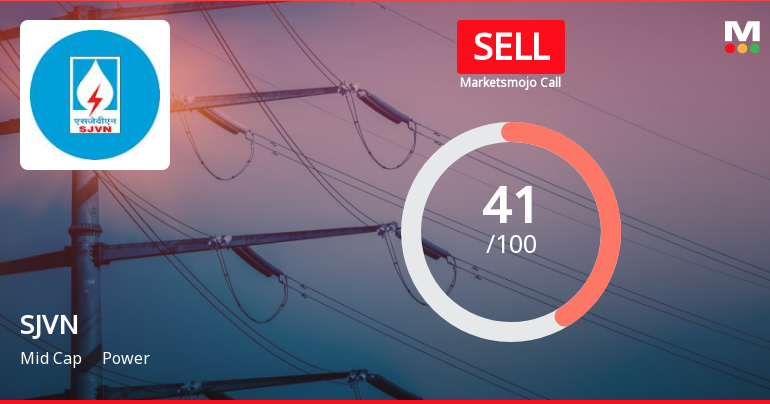
SJVN Ltd. is Rated Sell by MarketsMOJO
SJVN Ltd. is rated 'Sell' by MarketsMOJO, with this rating last updated on 11 February 2026. However, the analysis and financial metrics discussed here reflect the stock's current position as of 13 June 2026, providing investors with an up-to-date view of the company’s fundamentals, valuation, financial trends, and technical outlook.
Read full news article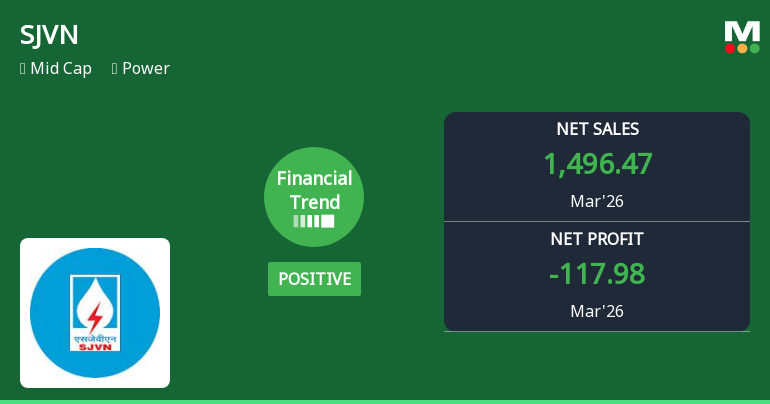
SJVN Ltd. Reports Strong Quarterly Turnaround Amidst Mixed Financial Indicators
SJVN Ltd., a mid-cap player in the power sector, has demonstrated a notable turnaround in its recent quarterly financial performance, shifting from a flat to a positive trend. Despite a challenging market environment and a recent downgrade in its Mojo Grade to 'Sell', the company posted record-high revenues and profitability in the quarter ended March 2026, signalling potential for renewed investor interest.
Read full news article Announcements
Brief Profile Of Newly Appointed Whole-Time Director (Projects)
12-Jun-2026 | Source : BSEBrief profile of newly appointed whole-time Director (Projects)
Announcement under Regulation 30 (LODR)-Change in Directorate
11-Jun-2026 | Source : BSEAppointment of Director (Projects)
Compliances-Reg.24(A)-Annual Secretarial Compliance
26-May-2026 | Source : BSEEnclosed
Corporate Actions

No Upcoming Board Meetings

SJVN Ltd. has declared 11% dividend, ex-date: 20 Feb 26

No Splits history available

No Bonus history available

No Rights history available
Quality key factors
Valuation key factors
Technicals key factors
 Technical Indicator Scale: Bearish, Mildly Bearish, Sideways, Mildly Bullish, Bullish Turned
 Shareholding Snapshot : Mar 2026
Shareholding Compare (%holding)
Promoters
None
Held by 20 Schemes (0.86%)
Held by 139 FIIs (2.75%)
President Of India (55.0%)
Life Insurance Corporation Of India (2.76%)
10.91%
Quarterly Results Snapshot (Consolidated) - Mar'26 - YoY

YoY Growth in quarter ended Mar 2026 is 196.68% vs 4.45% in Mar 2025
YoY Growth in quarter ended Mar 2026 is 7.54% vs -308.91% in Mar 2025
Half Yearly Results Snapshot (Consolidated) - Sep'25

Growth in half year ended Sep 2025 is 2.81% vs 22.11% in Sep 2024
Growth in half year ended Sep 2025 is -32.89% vs 12.21% in Sep 2024
Nine Monthly Results Snapshot (Consolidated) - Dec'25
YoY Growth in nine months ended Dec 2025 is 18.08% vs 22.47% in Dec 2024
YoY Growth in nine months ended Dec 2025 is -19.76% vs 11.40% in Dec 2024
Annual Results Snapshot (Consolidated) - Mar'26
YoY Growth in year ended Mar 2026 is 47.40% vs 19.10% in Mar 2025
YoY Growth in year ended Mar 2026 is -21.67% vs -10.07% in Mar 2025
About SJVN Ltd.

Company Coordinates


