
Compare Smartworks Cowor with Similar Stocks
Stock DNA
Diversified Commercial Services
INR 5,142 Cr (Small Cap)
510.00
32
0.00%
8.53
1.32%
9.66
Total Returns (Price + Dividend) 
Smartworks Cowor for the last several years.
Risk Adjusted Returns v/s
Returns Beta

News
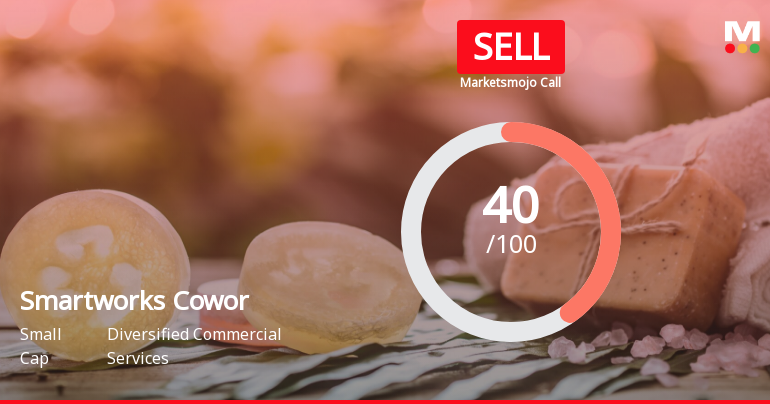
Smartworks Coworking Spaces Ltd is Rated Sell
Smartworks Coworking Spaces Ltd is rated 'Sell' by MarketsMOJO. This rating was last updated on 18 May 2026, reflecting a reassessment of the stock’s outlook. However, all fundamentals, returns, and financial metrics discussed here are current as of 10 June 2026, providing investors with the latest perspective on the company’s position.
Read full news article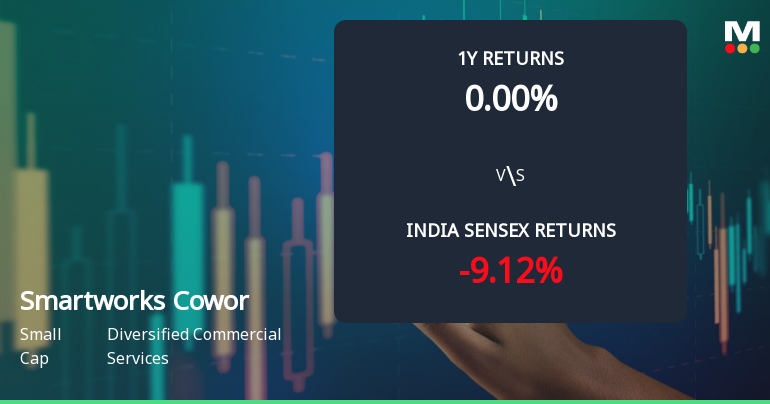
Smartworks Coworking Spaces Ltd Technical Momentum Shifts Amid Mixed Indicators
Smartworks Coworking Spaces Ltd, a small-cap player in the diversified commercial services sector, has experienced a notable shift in its technical momentum, moving from a sideways trend to a mildly bearish stance. Despite a modest day gain of 0.27%, the stock’s technical indicators present a complex picture, with some signals suggesting caution for investors amid a challenging market backdrop.
Read full news article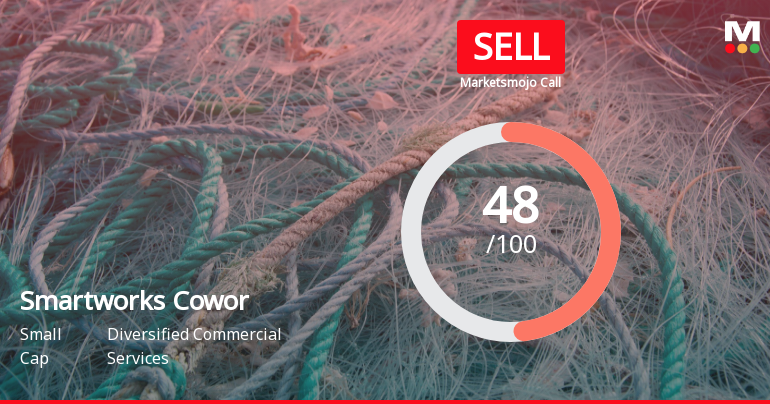
Smartworks Coworking Spaces Ltd is Rated Sell
Smartworks Coworking Spaces Ltd is rated Sell by MarketsMOJO. This rating was last updated on 18 May 2026, reflecting a shift from the previous Hold rating. However, the analysis and financial metrics discussed below are based on the stock’s current position as of 30 May 2026, providing investors with the most recent and relevant data to assess the company’s outlook.
Read full news article Announcements
Press Release - Smartworks Leases 400+ Seats To Japanese NBFC Subsidiary In Mumbai
08-Jun-2026 | Source : BSEPress Release - Smartworks leases 400+ seats to Japanese NBFC Subsidiary in Mumbai
Announcement under Regulation 30 (LODR)-Analyst / Investor Meet - Intimation
05-Jun-2026 | Source : BSEIntimation under Regulation 30 read with Schedule III of the Securities and Exchange Board of India (SEBI) (Listing Obligations and Disclosure Requirements) Regulations 2015 (SEBI Listing Regulations)- Analysts / Institutional Investor Meeting(s).
Compliances-Reg.24(A)-Annual Secretarial Compliance
29-May-2026 | Source : BSESubmission of Annual Secretarial Compliance Report for the Financial Year ended March 31 2026.
Corporate Actions

No Upcoming Board Meetings

No Dividend history available

No Splits history available

No Bonus history available

No Rights history available
Quality key factors
Valuation key factors
Technicals key factors
 Technical Indicator Scale: Bearish, Mildly Bearish, Sideways, Mildly Bullish, Bullish Turned
 Shareholding Snapshot : Mar 2026
Shareholding Compare (%holding)
Promoters
None
Held by 9 Schemes (3.15%)
Held by 7 FIIs (0.15%)
Ns Niketan (37.03%)
Space Solutions India Pte. Ltd. (14.9%)
7.71%
Quarterly Results Snapshot (Standalone) - Mar'26 - QoQ

QoQ Growth in quarter ended Mar 2026 is 9.90% vs 11.46% in Dec 2025

QoQ Growth in quarter ended Mar 2026 is 5,079.31% vs 107.63% in Dec 2025
Half Yearly Results Snapshot (Standalone) - Sep'25
Not Applicable: The company has declared_date for only one period
Not Applicable: The company has declared_date for only one period
Nine Monthly Results Snapshot (Standalone) - Dec'25
Not Applicable: The company has declared_date for only one period
Not Applicable: The company has declared_date for only one period
Annual Results Snapshot (Consolidated) - Mar'26
YoY Growth in year ended Mar 2026 is 30.69% vs 32.20% in Mar 2025
YoY Growth in year ended Mar 2026 is 116.67% vs -26.46% in Mar 2025
About Smartworks Coworking Spaces Ltd

Company Coordinates


