
Compare SML Mahindra with Similar Stocks
Dashboard
Healthy long term growth as Net Sales has grown by an annual rate of 36.84% and Operating profit at 31.80%
Positive results in Mar 26
With ROCE of 28.7, it has a Expensive valuation with a 7.7 Enterprise value to Capital Employed
Increasing Participation by Institutional Investors
Market Beating performance in long term as well as near term
Stock DNA
Automobiles
INR 5,912 Cr (Small Cap)
36.00
25
0.47%
0.52
30.76%
10.77
Total Returns (Price + Dividend) 
Latest dividend: 18 per share ex-dividend date: Jul-09-2025
Risk Adjusted Returns v/s
Returns Beta

News
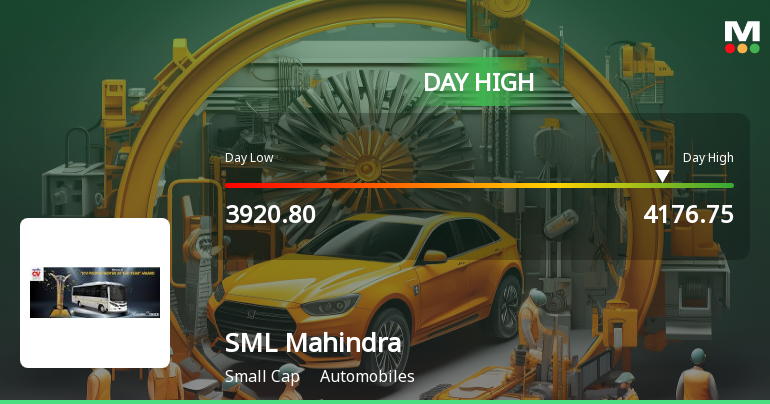
SML Mahindra Ltd Surges 7.04% to Day's High of Rs 4165.95 — Outperforms Sector by 1.72 Percentage Points
The Sensex advanced 1.42% on 15 Jun 2026, yet SML Mahindra Ltd outpaced the broader market with a 7.04% gain, touching an intraday high of Rs 4165.95. This 1.72 percentage-point outperformance over the Auto - Trucks sector’s 4.97% rise signals a distinctly stock-specific momentum shift rather than a mere market tailwind.
Read full news article
SML Mahindra Ltd is Rated Hold
SML Mahindra Ltd is rated 'Hold' by MarketsMOJO, with this rating last updated on 27 Oct 2025. However, the analysis and financial metrics discussed here reflect the company’s current position as of 13 June 2026, providing investors with an up-to-date view of the stock’s fundamentals, valuation, financial trends, and technical outlook.
Read full news article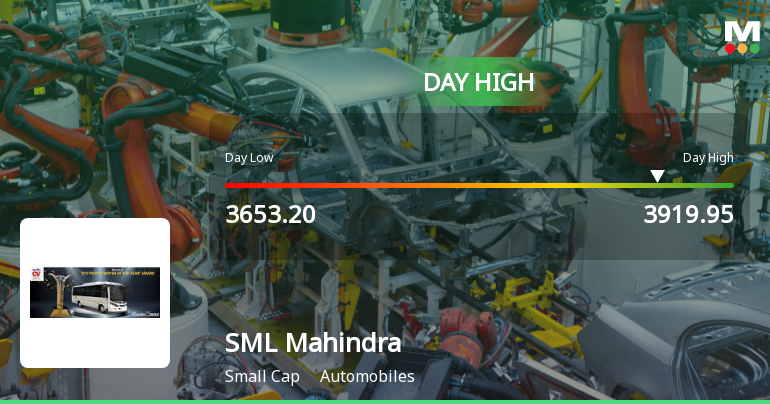
SML Mahindra Ltd Surges 7.18% to Day's High of Rs 3891 — Outperforms Sector by 7.34 Percentage Points
The Sensex edged down by 0.07% on 2 Jun 2026, while SML Mahindra Ltd surged 7.18%, reaching an intraday high of Rs 3891. This 7.34-percentage-point outperformance over its sector highlights a distinctly stock-specific rally in a broadly subdued market environment.
Read full news article Announcements
Announcement under Regulation 30 (LODR)-Resignation of Director
10-Jun-2026 | Source : BSECessation of Dr. Venkataraman Srinivas (DIN: 11163042) as Executive Director & Chief Executive Officer of the Company with effect from the close of 30th June 2026 on account of his transition to a new role within the Mahindra Group. Consequently he will cease to be a Director and Key Managerial Personnel of the Company under the Companies Act 2013 and the SEBI Listing Regulations with effect from the said date.
Board Meeting Outcome for Outcome Of Board Meeting - Intimation Under Regulation 30 Read With Schedule III Of The SEBI (Listing Obligations And Disclosure Requirements) Regulations 2015 (SEBI Listing Regulations)
10-Jun-2026 | Source : BSEOutcome of Board meeting
Announcement under Regulation 30 (LODR)-Resignation of Chief Executive Officer (CEO)
10-Jun-2026 | Source : BSECessation of Dr. Venkataraman Srinivas (DIN: 11163042) as Executive Director & Chief Executive Officer of the Company with effect from the close of 30th June 2026 on account of his transition to a new role within the Mahindra Group. Consequently he will cease to be a Director and Key Managerial Personnel of the Company under the Companies Act 2013 and the SEBI Listing Regulations with effect from the said date.
Corporate Actions

No Upcoming Board Meetings

SML Mahindra Ltd has declared 235% dividend, ex-date: 03 Jul 26

No Splits history available

No Bonus history available

SML Mahindra Ltd has announced 19:50 rights issue, ex-date: 09 Feb 10
Quality key factors
Valuation key factors
Technicals key factors
 Technical Indicator Scale: Bearish, Mildly Bearish, Sideways, Mildly Bullish, Bullish Turned
 Shareholding Snapshot : Mar 2026
Shareholding Compare (%holding)
Promoters
None
Held by 5 Schemes (0.12%)
Held by 45 FIIs (0.77%)
Mahindra & Mahindra Limited (58.97%)
Sachin Bansal (partner Of Navodaya Enterprises) (4.9%)
32.5%
Quarterly Results Snapshot (Standalone) - Mar'26 - YoY

YoY Growth in quarter ended Mar 2026 is 16.45% vs 13.42% in Mar 2025
YoY Growth in quarter ended Mar 2026 is 2.36% vs 1.20% in Mar 2025
Half Yearly Results Snapshot (Standalone) - Sep'25

Growth in half year ended Sep 2025 is 8.12% vs 14.65% in Sep 2024
Growth in half year ended Sep 2025 is 29.07% vs 28.95% in Sep 2024
Nine Monthly Results Snapshot (Standalone) - Dec'25
YoY Growth in nine months ended Dec 2025 is 19.21% vs 7.34% in Dec 2024
YoY Growth in nine months ended Dec 2025 is 53.59% vs 23.69% in Dec 2024
Annual Results Snapshot (Standalone) - Mar'26
YoY Growth in year ended Mar 2026 is 18.30% vs 9.25% in Mar 2025
YoY Growth in year ended Mar 2026 is 31.30% vs 12.78% in Mar 2025
About SML Mahindra Ltd

Company Coordinates


