
Compare Solarworld Ene. with Similar Stocks
Dashboard
High Management Efficiency with a high ROE of 0%
The company is Net-Debt Free
Healthy long term growth as Net Sales has grown by an annual rate of 0%
With a growth in Net Sales of 3.25%, the company declared Very Positive results in Mar 26
With ROE of 15.4, it has a Very Attractive valuation with a 1.9 Price to Book Value
Total Returns (Price + Dividend) 
Solarworld Ene. for the last several years.
Risk Adjusted Returns v/s
Returns Beta

News
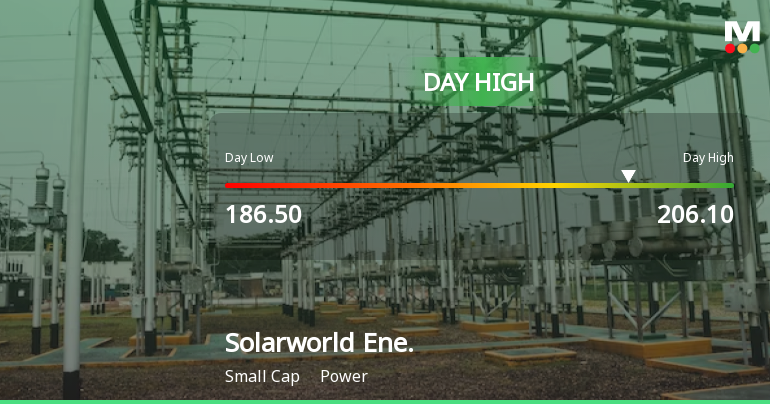
Solarworld Energy Solutions Ltd Surges 8.02% to Day's High of Rs 197.15 — Outperforms Power Sector by 6.23 Percentage Points
The Sensex advanced 0.68% on 3 Jul 2026, yet Solarworld Energy Solutions Ltd outpaced the broader market with an 8.02% gain, touching an intraday high of Rs 197.15. This 6.23 percentage-point outperformance over the Power sector signals a distinctly stock-specific rally rather than a general market lift.
Read full news article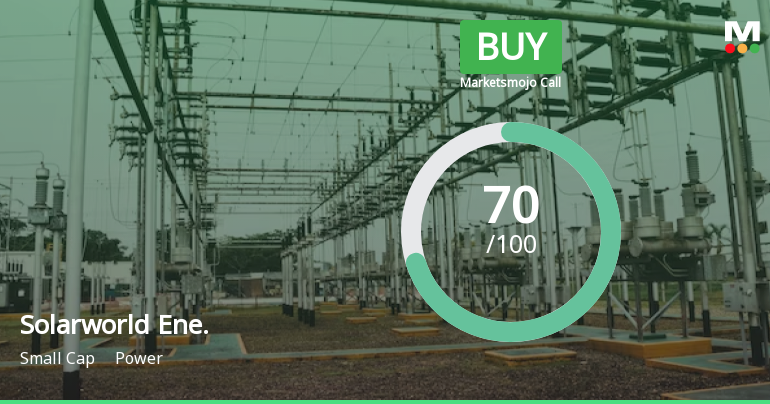
Solarworld Energy Solutions Ltd Downgraded to Buy Amid Technical Setbacks
Solarworld Energy Solutions Ltd, a small-cap player in the power sector, has seen its investment rating downgraded from Strong Buy to Buy as of 1 July 2026. This adjustment reflects a nuanced reassessment across four key parameters: quality, valuation, financial trend, and technicals. While the company continues to demonstrate robust financial performance and attractive valuation metrics, a shift in technical indicators has tempered the overall outlook.
Read full news article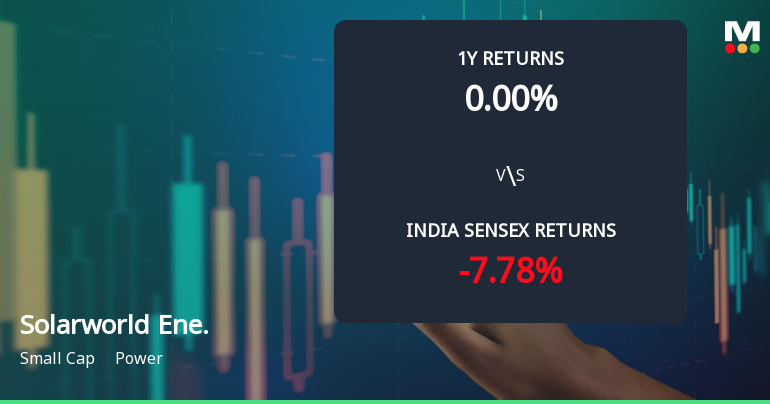
Solarworld Energy Solutions Ltd Sees Technical Momentum Shift Amid Mixed Returns
Solarworld Energy Solutions Ltd, a small-cap player in the power sector, has experienced a notable shift in its technical momentum, transitioning from a mildly bullish stance to a sideways trend. This change is reflected in key technical indicators such as MACD, RSI, and moving averages, signalling a period of consolidation after recent price movements.
Read full news article Announcements
Closure of Trading Window
30-Jun-2026 | Source : BSEIntimation for closure of trading window
Shareholder Meeting / Postal Ballot-Scrutinizers Report
15-Jun-2026 | Source : BSEPostal Ballot- Scrutinizers Report
Shareholder Meeting / Postal Ballot-Outcome of Postal_Ballot
15-Jun-2026 | Source : BSEOutcome of Postal Ballot
Corporate Actions

No Upcoming Board Meetings

No Dividend history available

No Splits history available

No Bonus history available

No Rights history available
Quality key factors
Valuation key factors
Technicals key factors
 Technical Indicator Scale: Bearish, Mildly Bearish, Sideways, Mildly Bullish, Bullish Turned
 Shareholding Snapshot : Mar 2026
Shareholding Compare (%holding)
Promoters
None
Held by 1 Schemes (1.73%)
Held by 8 FIIs (1.24%)
Pioneer Facor It Infradevelopers Private Limited (32.01%)
Valuequest S C A L E Fund (4.83%)
20.11%
Quarterly Results Snapshot (Standalone) - Mar'26 - QoQ

QoQ Growth in quarter ended Mar 2026 is 3.25% vs 290.65% in Dec 2025
QoQ Growth in quarter ended Mar 2026 is -1.34% vs 233.14% in Dec 2025
Half Yearly Results Snapshot (Standalone) - Sep'25
Not Applicable: The company has declared_date for only one period
Not Applicable: The company has declared_date for only one period
Nine Monthly Results Snapshot (Standalone) - Dec'25
Not Applicable: The company has declared_date for only one period
Not Applicable: The company has declared_date for only one period
Annual Results Snapshot (Standalone) - Mar'26
Not Applicable: The company has declared_date for only one period
Not Applicable: The company has declared_date for only one period
About Solarworld Energy Solutions Ltd

Company Coordinates


