
Compare Som Distilleries with Similar Stocks
Dashboard
With a fall in Net Sales of -46.66%, the company declared Very Negative results in Mar 26
- The company has declared negative results for the last 3 consecutive quarters
- INTEREST(Latest six months) At Rs 15.15 cr has Grown at 53.81%
- PAT(Q) At Rs -43.61 cr has Fallen at -291.9%
- ROCE(HY) Lowest at 6.01%
Despite the size of the company, domestic mutual funds hold only 0% of the company
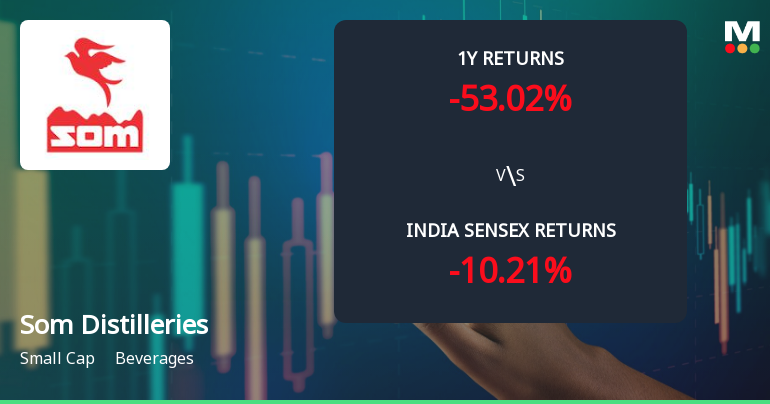
Below par performance in long term as well as near term
Total Returns (Price + Dividend) 
Latest dividend: 0.25 per share ex-dividend date: Dec-02-2022
Risk Adjusted Returns v/s
Returns Beta

News
Som Distilleries & Breweries Ltd Faces Bearish Momentum Amid Technical Downturn
Som Distilleries & Breweries Ltd, a small-cap player in the beverages sector, has experienced a notable shift in its technical momentum, with recent indicators signalling a bearish trend. Despite some mildly bullish weekly signals, the overall technical landscape points to increased selling pressure, reflected in a 3.47% decline in the stock price on 11 Jun 2026 and a downgrade in its Mojo Grade from Strong Sell to Sell.
Read full news article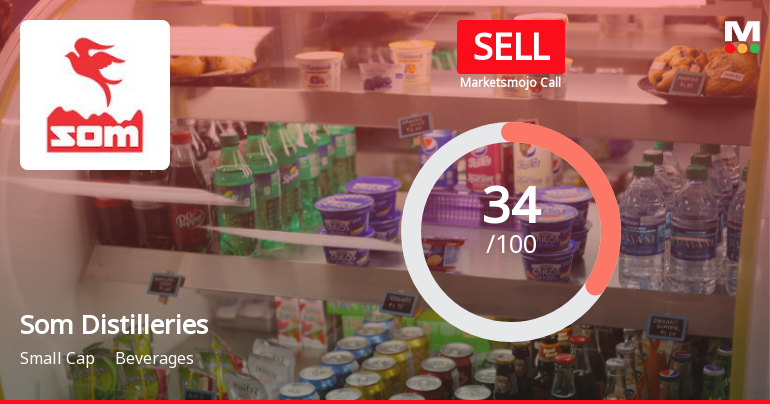
Som Distilleries & Breweries Ltd Downgraded to Sell Amid Mixed Financial Signals
Som Distilleries & Breweries Ltd has been downgraded from a Strong Sell to a Sell rating following a series of disappointing quarterly results and deteriorating financial metrics. The downgrade reflects a comprehensive reassessment across quality, valuation, financial trend, and technical parameters, signalling caution for investors amid ongoing operational challenges and market underperformance.
Read full news articleAre Som Distilleries & Breweries Ltd latest results good or bad?
Som Distilleries & Breweries Ltd's latest financial results for Q4 FY26 indicate significant operational challenges. The company reported net sales of ₹180.81 crores, reflecting a substantial decline of 46.66% year-on-year, marking the lowest quarterly sales figure in recent history. This decline is compounded by a net loss of ₹55.48 crores, which represents a drastic deterioration compared to the previous year. The operating margin turned negative at -24.43%, indicating severe issues with cost management and pricing power, as the company lost ₹24.43 for every ₹100 of sales generated. This is a stark contrast to the positive operating margin of 12.32% reported in Q4 FY25. Additionally, the profit before tax (PBT) plummeted to ₹-70.60 crores, further highlighting the financial distress faced by the company. The results suggest that the company is grappling with structural issues rather than temporary setba...
Read full news article Announcements
Announcement under Regulation 30 (LODR)-Press Release / Media Release
11-Jun-2026 | Source : BSEIntimation of Commencement of Commercial Production at the Brewery facility of our Wholly Owned Subsidiary -Woodpecker Green Agri Nutrients Private Limited
Announcement under Regulation 30 (LODR)-Earnings Call Transcript
05-Jun-2026 | Source : BSEDear Sir/Madam Please find attached Earning Conference Call Transcript for the Q4 & Financial Year ended 31st March 2026
Announcement under Regulation 30 (LODR)-Analyst / Investor Meet - Outcome
02-Jun-2026 | Source : BSEEARNINGS CONFERENCE CALL AUDIO RECORDING Q4 FY2026
Corporate Actions

No Upcoming Board Meetings

Som Distilleries & Breweries Ltd has declared 5% dividend, ex-date: 02 Dec 22

Som Distilleries & Breweries Ltd has announced 2:5 stock split, ex-date: 24 May 24

No Bonus history available

Som Distilleries & Breweries Ltd has announced 10:211 rights issue, ex-date: 13 Apr 23
Quality key factors
Valuation key factors
Technicals key factors
 Technical Indicator Scale: Bearish, Mildly Bearish, Sideways, Mildly Bullish, Bullish Turned
 Shareholding Snapshot : Mar 2026
Shareholding Compare (%holding)
Non Institution
None
Held by 0 Schemes
Held by 18 FIIs (1.2%)
Jagdish Kumar Arora (23.71%)
Anil Kumar Arora (2.46%)
50.76%
Quarterly Results Snapshot (Consolidated) - Mar'26 - YoY

YoY Growth in quarter ended Mar 2026 is -46.66% vs -11.17% in Mar 2025
YoY Growth in quarter ended Mar 2026 is -344.08% vs 20.78% in Mar 2025
Half Yearly Results Snapshot (Consolidated) - Sep'25
Growth in half year ended Sep 2025 is -0.60% vs 26.88% in Sep 2024
Growth in half year ended Sep 2025 is 3.90% vs 22.11% in Sep 2024
Nine Monthly Results Snapshot (Consolidated) - Dec'25
YoY Growth in nine months ended Dec 2025 is -5.02% vs 22.79% in Dec 2024
YoY Growth in nine months ended Dec 2025 is -15.65% vs 17.95% in Dec 2024
Annual Results Snapshot (Consolidated) - Mar'26
YoY Growth in year ended Mar 2026 is -14.80% vs 12.67% in Mar 2025
YoY Growth in year ended Mar 2026 is -90.22% vs 12.46% in Mar 2025
About Som Distilleries & Breweries Ltd

Company Coordinates


