
Compare SPML Infra with Similar Stocks
Dashboard
High Debt company with Weak Long Term Fundamental Strength
- Poor long term growth as Net Sales has grown by an annual rate of 4.87% over the last 5 years
- High Debt Company with a Debt to Equity ratio (avg) of 2.34 times
- The company has been able to generate a Return on Equity (avg) of 2.86% signifying low profitability per unit of shareholders funds
Despite the size of the company, domestic mutual funds hold only 0% of the company
Underperformed the market in the last 1 year
Total Returns (Price + Dividend) 
Latest dividend: 0.5 per share ex-dividend date: Sep-26-2011
Risk Adjusted Returns v/s
Returns Beta

News
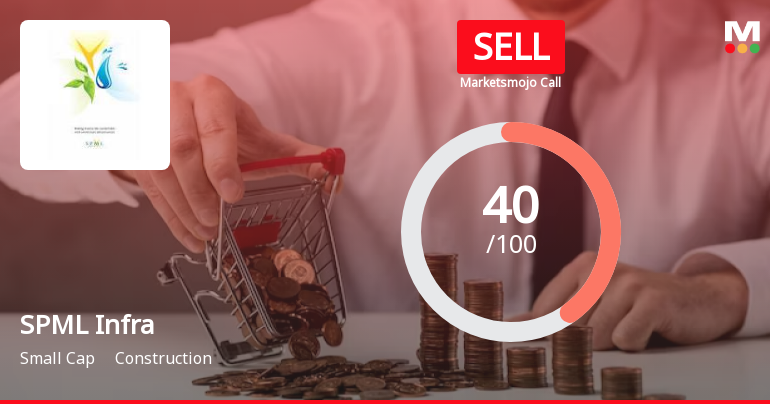
SPML Infra Ltd is Rated Sell
SPML Infra Ltd is rated 'Sell' by MarketsMOJO, with this rating last updated on 27 April 2026. However, the analysis and financial metrics discussed here reflect the stock’s current position as of 11 June 2026, providing investors with an up-to-date view of the company’s fundamentals, valuation, financial trends, and technical outlook.
Read full news article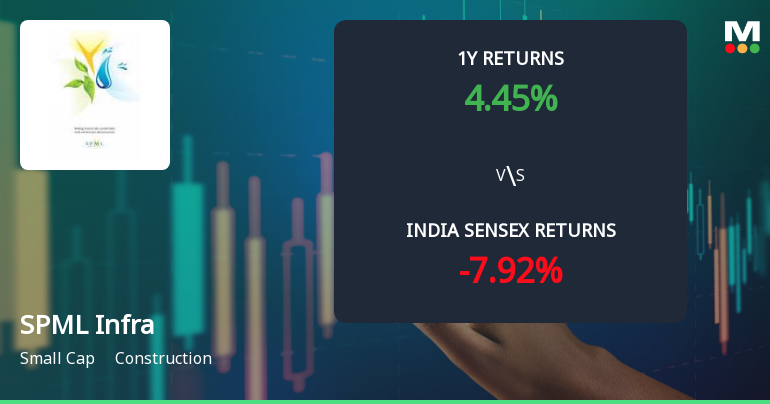
SPML Infra Ltd Technical Momentum Shifts Amid Mixed Indicator Signals
SPML Infra Ltd, a small-cap player in the construction sector, has experienced a notable shift in its technical momentum, moving from a sideways trend to a mildly bearish stance. Despite a recent downgrade in its Mojo Grade from Hold to Sell, the stock’s mixed technical indicators suggest a complex outlook for investors navigating the current market environment.
Read full news article
SPML Infra Ltd Technical Momentum Shifts Amid Mixed Indicator Signals
SPML Infra Ltd has experienced a notable shift in its technical momentum, moving from a mildly bearish stance to a more sideways trend, reflecting a complex interplay of bullish and bearish signals across key indicators. Despite a recent 2.55% gain in daily price, the company’s technical and fundamental outlook remains cautious, with a downgrade in its Mojo Grade to Sell from Hold on 27 April 2026.
Read full news article Announcements
Announcement under Regulation 30 (LODR)-Earnings Call Transcript
04-Jun-2026 | Source : BSETranscript of earnings call for Q4 Year Financial year ended 31st March 2026
Announcement under Regulation 30 (LODR)-Analyst / Investor Meet - Intimation
04-Jun-2026 | Source : BSEIntimation of Analyst/Investor meet
Announcement under Regulation 30 (LODR)-Investor Presentation
01-Jun-2026 | Source : BSEInvestor presentation for Quarter $ and year ended 31st march 2026
Corporate Actions

No Upcoming Board Meetings

SPML Infra Ltd has declared 25% dividend, ex-date: 26 Sep 11

No Splits history available

No Bonus history available

No Rights history available
Quality key factors
Valuation key factors
Technicals key factors
 Technical Indicator Scale: Bearish, Mildly Bearish, Sideways, Mildly Bullish, Bullish Turned
 Shareholding Snapshot : Apr 2026
Shareholding Compare (%holding)
Non Institution
24.534
Held by 0 Schemes
Held by 12 FIIs (0.36%)
Zoom Industrial Services Ltd (18.32%)
National Asset Reconstruction Company Limited (13.22%)
25.57%
Quarterly Results Snapshot (Consolidated) - Mar'26 - YoY

YoY Growth in quarter ended Mar 2026 is 53.68% vs -59.01% in Mar 2025

YoY Growth in quarter ended Mar 2026 is 126.31% vs 235.40% in Mar 2025
Half Yearly Results Snapshot (Consolidated) - Sep'25
Growth in half year ended Sep 2025 is -13.07% vs -34.71% in Sep 2024
Growth in half year ended Sep 2025 is 4.50% vs 3,189.87% in Sep 2024
Nine Monthly Results Snapshot (Consolidated) - Dec'25
YoY Growth in nine months ended Dec 2025 is -1.68% vs -32.01% in Dec 2024
YoY Growth in nine months ended Dec 2025 is 32.20% vs 1,791.05% in Dec 2024
Annual Results Snapshot (Consolidated) - Mar'26
YoY Growth in year ended Mar 2026 is 11.76% vs -41.09% in Mar 2025
YoY Growth in year ended Mar 2026 is 55.78% vs 787.80% in Mar 2025
About SPML Infra Ltd

Company Coordinates


