
Compare SRM Contractors with Similar Stocks
Dashboard
The company is Net-Debt Free
Healthy long term growth as Net Sales has grown by an annual rate of 73.06% and Operating profit at 118.52%
With a growth in Net Profit of 124.44%, the company declared Outstanding results in Mar 26
With ROE of 29.9, it has a Attractive valuation with a 3 Price to Book Value
Despite the size of the company, domestic mutual funds hold only 0% of the company
Stock DNA
Construction
INR 1,087 Cr (Micro Cap)
10.00
32
0.00%
-0.13
29.92%
2.88
Total Returns (Price + Dividend) 
SRM Contractors for the last several years.
Risk Adjusted Returns v/s
Returns Beta

News
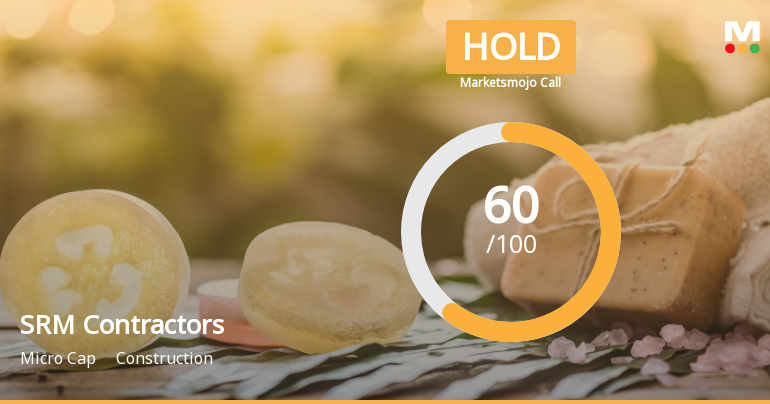
SRM Contractors Ltd is Rated Hold
SRM Contractors Ltd is rated 'Hold' by MarketsMOJO, with this rating last updated on 01 June 2026. However, the analysis and financial metrics discussed here reflect the stock's current position as of 11 June 2026, providing investors with the latest insights into the company’s performance and outlook.
Read full news article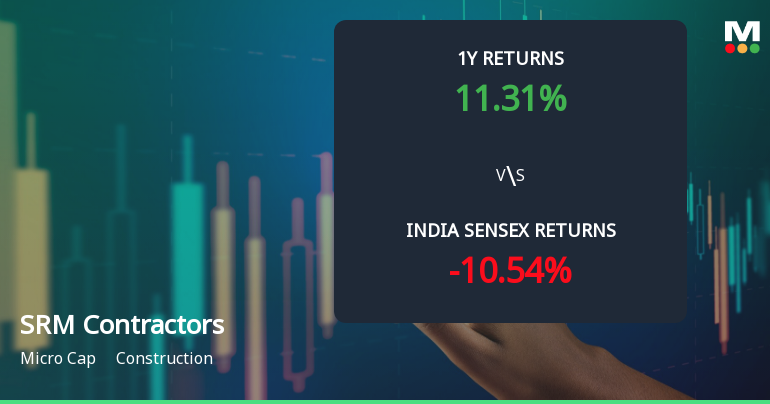
SRM Contractors Ltd Technical Momentum Shifts Amid Market Pressure
SRM Contractors Ltd, a micro-cap player in the construction sector, has experienced a notable shift in its technical momentum, moving from a sideways trend to a mildly bearish stance. Recent price action and technical indicators reveal a complex picture, with mixed signals from MACD, RSI, moving averages, and other momentum oscillators, prompting a downgrade in its Mojo Grade from Buy to Hold as of 1 June 2026.
Read full news article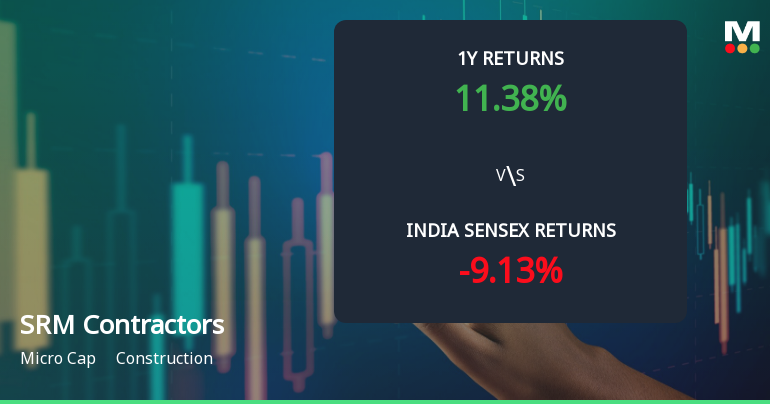
SRM Contractors Ltd Technical Momentum Shifts Amid Sideways Trend
SRM Contractors Ltd, a micro-cap player in the construction sector, has witnessed a notable shift in its technical momentum, moving from a mildly bullish stance to a sideways trend. This transition is underscored by a complex interplay of technical indicators including MACD, RSI, moving averages, and Bollinger Bands, reflecting a cautious market sentiment despite the company’s resilient year-to-date and one-year returns.
Read full news article Announcements
Announcement under Regulation 30 (LODR)-Analyst / Investor Meet - Intimation
08-Jun-2026 | Source : BSEIntimation of schedule in relation to Analysts/ Institutional Investors Meetings
Announcement under Regulation 30 (LODR)-Earnings Call Transcript
02-Jun-2026 | Source : BSEEarning Call Transcript
Announcement under Regulation 30 (LODR)-Analyst / Investor Meet - Outcome
28-May-2026 | Source : BSEEarning Call
Corporate Actions

No Upcoming Board Meetings

No Dividend history available

No Splits history available

No Bonus history available

No Rights history available
Quality key factors
Valuation key factors
Technicals key factors
 Technical Indicator Scale: Bearish, Mildly Bearish, Sideways, Mildly Bullish, Bullish Turned
 Shareholding Snapshot : Mar 2026
Shareholding Compare (%holding)
Promoters
None
Held by 0 Schemes
Held by 7 FIIs (0.44%)
Sanjay Mehta (62.02%)
Ajay Upadhyaya (1.59%)
21.26%
Quarterly Results Snapshot (Consolidated) - Mar'26 - QoQ

QoQ Growth in quarter ended Mar 2026 is 92.79% vs 12.12% in Dec 2025
QoQ Growth in quarter ended Mar 2026 is 124.48% vs 20.02% in Dec 2025
Half Yearly Results Snapshot (Consolidated) - Sep'25
Growth in half year ended Sep 2025 is 132.24% vs 1.53% in Sep 2024
Growth in half year ended Sep 2025 is 117.13% vs -6.67% in Sep 2024
Nine Monthly Results Snapshot (Consolidated) - Dec'25
YoY Growth in nine months ended Dec 2025 is 92.92% vs 28.14% in Dec 2024
YoY Growth in nine months ended Dec 2025 is 82.94% vs 54.83% in Dec 2024
Annual Results Snapshot (Consolidated) - Mar'26
YoY Growth in year ended Mar 2026 is 94.19% vs 54.23% in Mar 2025

YoY Growth in year ended Mar 2026 is 101.85% vs 103.93% in Mar 2025
About SRM Contractors Ltd

Company Coordinates


