
Compare Subros with Similar Stocks
Dashboard
The company is Net-Debt Free
Healthy long term growth as Operating profit has grown by an annual rate 26.45%
Flat results in Mar 26
With ROE of 13.8, it has a Fair valuation with a 4.3 Price to Book Value
High Institutional Holdings at 43.56%
Underperformed the market in the last 1 year
Stock DNA
Auto Components & Equipments
INR 5,408 Cr (Small Cap)
32.00
37
0.32%
-0.09
13.82%
4.31
Total Returns (Price + Dividend) 
Latest dividend: 2.6 per share ex-dividend date: Sep-11-2025
Risk Adjusted Returns v/s
Returns Beta

News

Subros Ltd Technical Momentum Shifts Signal Mildly Bullish Outlook Amid Mixed Indicators
Subros Ltd, a key player in the Auto Components & Equipments sector, has exhibited a notable shift in its technical momentum, moving from a sideways trend to a mildly bullish stance. Recent technical indicators including MACD, Bollinger Bands, and Dow Theory signals suggest a cautiously optimistic outlook, despite some mixed signals from moving averages and monthly momentum oscillators.
Read full news article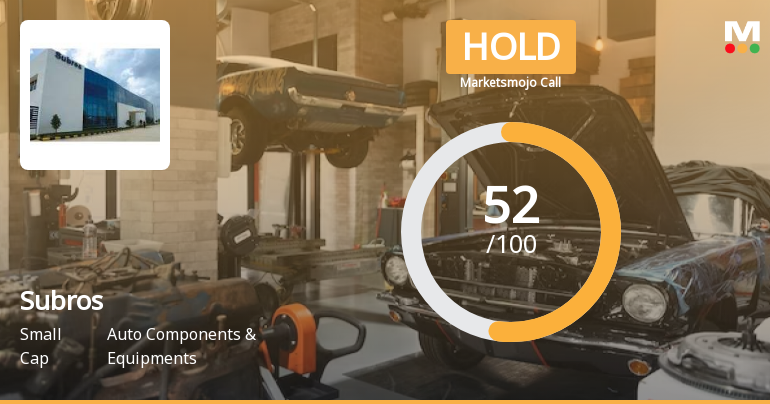
Subros Ltd is Rated Hold by MarketsMOJO
Subros Ltd is rated 'Hold' by MarketsMOJO, with this rating last updated on 20 May 2026. However, the analysis and financial metrics discussed here reflect the company’s current position as of 23 June 2026, providing investors with the most up-to-date view of the stock’s fundamentals, returns, and market standing.
Read full news article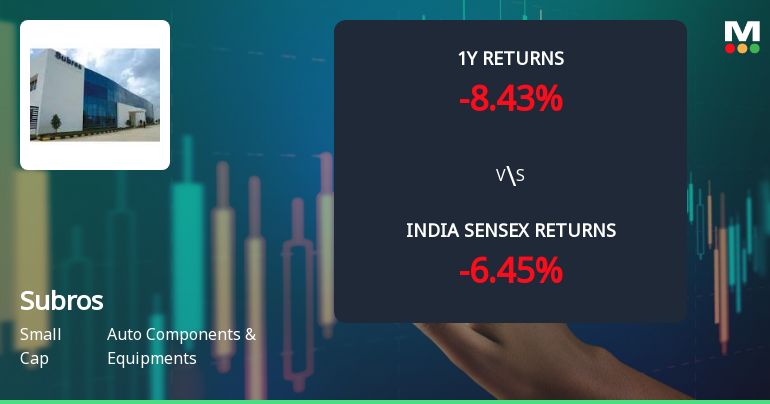
Subros Ltd Technical Momentum Shifts Amid Strong Price Rally
Subros Ltd, a small-cap player in the Auto Components & Equipments sector, has exhibited a notable shift in its technical momentum, moving from a mildly bearish stance to a more sideways trend. This change is underscored by a strong day gain of 14.42%, with the stock closing at ₹856.15, up from the previous close of ₹748.25. The evolving technical indicators suggest a potential stabilisation phase, offering investors a nuanced view of the stock’s near-term prospects.
Read full news article Announcements
Announcement under Regulation 30 (LODR)-Newspaper Publication
11-Jun-2026 | Source : BSEProof of publication for notice to shareholders
Announcement under Regulation 30 (LODR)-Earnings Call Transcript
26-May-2026 | Source : BSEEarning Call Transcript Q4 (2025-26)
Compliances-Reg.24(A)-Annual Secretarial Compliance
26-May-2026 | Source : BSEAnnual Secretarial Compliance Report 2025-26
Corporate Actions

No Upcoming Board Meetings

Subros Ltd has declared 130% dividend, ex-date: 11 Sep 25

Subros Ltd has announced 2:10 stock split, ex-date: 20 Nov 07

No Bonus history available

No Rights history available
Quality key factors
Valuation key factors
Technicals key factors
 Technical Indicator Scale: Bearish, Mildly Bearish, Sideways, Mildly Bullish, Bullish Turned
 Shareholding Snapshot : Mar 2026
Shareholding Compare (%holding)
Promoters
None
Held by 10 Schemes (10.76%)
Held by 39 FIIs (32.79%)
Deeksha Holding Limited (15.54%)
Denso Corporation (20%)
10.47%
Quarterly Results Snapshot (Consolidated) - Mar'26 - YoY

YoY Growth in quarter ended Mar 2026 is 15.55% vs 9.25% in Mar 2025

YoY Growth in quarter ended Mar 2026 is 6.77% vs 51.82% in Mar 2025
Half Yearly Results Snapshot (Consolidated) - Sep'25
Growth in half year ended Sep 2025 is 7.32% vs 8.73% in Sep 2024
Growth in half year ended Sep 2025 is 14.23% vs 77.11% in Sep 2024
Nine Monthly Results Snapshot (Consolidated) - Dec'25
YoY Growth in nine months ended Dec 2025 is 10.03% vs 9.83% in Dec 2024
YoY Growth in nine months ended Dec 2025 is 11.49% vs 55.30% in Dec 2024
Annual Results Snapshot (Consolidated) - Mar'26
YoY Growth in year ended Mar 2026 is 11.52% vs 9.67% in Mar 2025
YoY Growth in year ended Mar 2026 is 10.04% vs 54.22% in Mar 2025
About Subros Ltd

Company Coordinates


