
Compare Sudeep Pharma with Similar Stocks
Dashboard
High Management Efficiency with a high ROE of 0%
Strong ability to service debt as the company has a low Debt to EBITDA ratio of 0.68 times
Poor long term growth as Operating profit has grown by an annual rate 0% of over the last 5 years
Positive results in Mar 26
With ROE of 19.6, it has a Very Expensive valuation with a 10.5 Price to Book Value
Majority shareholders : Promoters
Stock DNA
Pharmaceuticals & Biotechnology
INR 8,635 Cr (Small Cap)
54.00
34
0.00%
0.04
19.57%
9.62
Total Returns (Price + Dividend) 
Sudeep Pharma for the last several years.
Risk Adjusted Returns v/s
Returns Beta

News
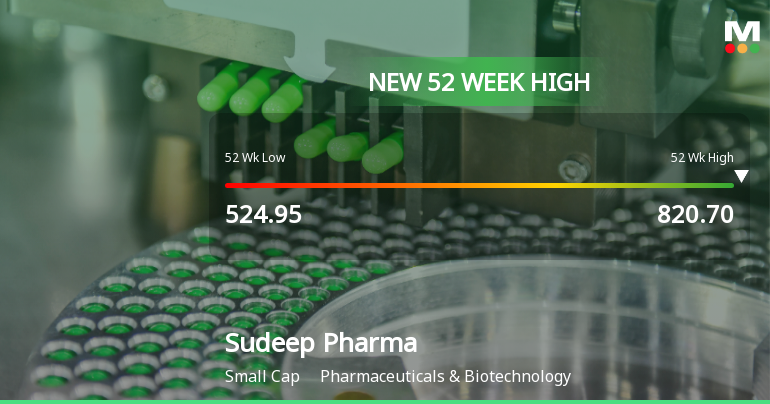
Broad-Based Technical Strength Lifts Sudeep Pharma Ltd to 52-Week High of Rs 820.7
Surging to an intraday peak of Rs 820.7 on 15 Jun 2026, Sudeep Pharma Ltd has marked a fresh 52-week high, propelled by a confluence of robust technical signals and sustained price momentum that outpaced its sector peers.
Read full news article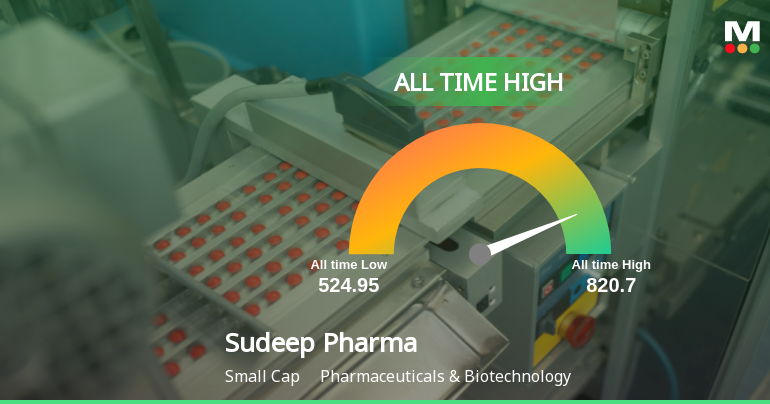
Sudeep Pharma Ltd Hits All-Time High of Rs 824.45 as Momentum Accelerates
Extending its recent rally, Sudeep Pharma Ltd surged 10.00% on 15 Jun 2026 to close at Rs 824.45, marking a fresh all-time high. This move outpaced the Sensex gain of 1.29% and reinforced the stock’s strong short-term momentum across multiple timeframes.
Read full news article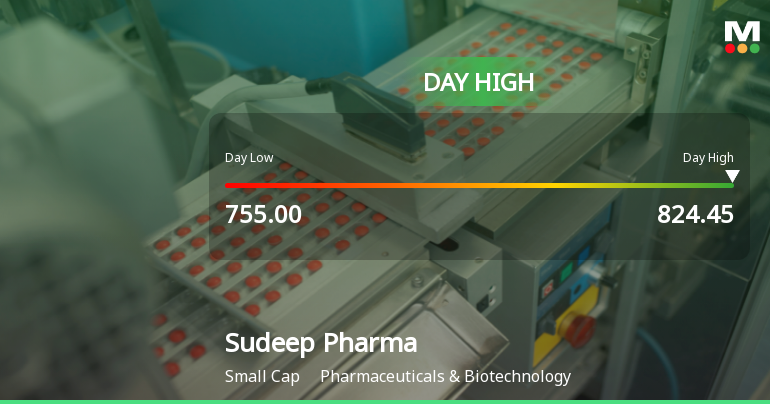
Sudeep Pharma Ltd Surges 8.99% to Day's High of Rs 796.55 — Outperforms Sector by 6.86 Percentage Points
The Sensex gained 1.27% on 15 Jun 2026, yet Sudeep Pharma Ltd outpaced the broader market with an 8.99% surge, reaching an intraday high of Rs 796.55. This 6.86-percentage-point outperformance over its Pharmaceuticals & Biotechnology sector peers signals a distinctly stock-specific rally rather than a market-wide lift.
Read full news article Announcements
Announcement under Regulation 30 (LODR)-Earnings Call Transcript
28-May-2026 | Source : BSESubmission of Earnings Call Transcript for Q4 FY26.
Compliances-Reg.24(A)-Annual Secretarial Compliance
27-May-2026 | Source : BSESubmission of Annual Secretarial Compliance Report for FY 2025-26
Announcement under Regulation 30 (LODR)-Analyst / Investor Meet - Intimation
23-May-2026 | Source : BSEPursuant to Regulation 30 of the SEBI (Listing Obligation and Disclosure Requirements) Regulations 2015 as amended from time to time we herewith submit the participation of Company Officials in various Investor Conferences in Mumbai as annexed.
Corporate Actions

No Upcoming Board Meetings

No Dividend history available

No Splits history available

No Bonus history available

No Rights history available
Quality key factors
Valuation key factors
Technicals key factors
 Technical Indicator Scale: Bearish, Mildly Bearish, Sideways, Mildly Bullish, Bullish Turned
 Shareholding Snapshot : Mar 2026
Shareholding Compare (%holding)
Promoters
None
Held by 14 Schemes (6.19%)
Held by 13 FIIs (1.55%)
Riva Resources Private Limited (40.35%)
Nuvama Crossover Opportunities Fund - Series Iii (3.42%)
3.11%
Quarterly Results Snapshot (Standalone) - Mar'26 - QoQ

QoQ Growth in quarter ended Mar 2026 is -11.20% vs 2.73% in Dec 2025

QoQ Growth in quarter ended Mar 2026 is -4.09% vs -9.65% in Dec 2025
Half Yearly Results Snapshot (Standalone) - Sep'25
Not Applicable: The company has declared_date for only one period
Not Applicable: The company has declared_date for only one period
Nine Monthly Results Snapshot (Standalone) - Dec'25
Not Applicable: The company has declared_date for only one period
Not Applicable: The company has declared_date for only one period
Annual Results Snapshot (Consolidated) - Mar'26
YoY Growth in year ended Mar 2026 is 27.94% vs 9.30% in Mar 2025
YoY Growth in year ended Mar 2026 is 24.62% vs 4.16% in Mar 2025
About Sudeep Pharma Ltd

Company Coordinates


