
Compare Viyash Scientifi with Similar Stocks
Dashboard
Weak Long Term Fundamental Strength with an average Return on Capital Employed (ROCE) of 5.81%
- Poor long term growth as Operating profit has grown by an annual rate 18.70% of over the last 5 years
With a growth in Net Profit of 539.5%, the company declared Outstanding results in Mar 26
With ROE of 6.5, it has a Expensive valuation with a 4.4 Price to Book Value
Majority shareholders : Promoters
Consistent Returns over the last 3 years
Stock DNA
Pharmaceuticals & Biotechnology
INR 12,573 Cr (Small Cap)
68.00
36
0.00%
0.08
6.50%
4.42
Total Returns (Price + Dividend) 
Latest dividend: 0.5 per share ex-dividend date: Sep-08-2021
Risk Adjusted Returns v/s
Returns Beta

News

Viyash Scientific Ltd is Rated Hold
Viyash Scientific Ltd is rated 'Hold' by MarketsMOJO, with this rating last updated on 11 May 2026. However, the analysis and financial metrics presented here reflect the stock's current position as of 06 July 2026, providing investors with an up-to-date view of its fundamentals, returns, and market standing.
Read full news article
Broad-Based Technical Strength Lifts Viyash Scientific Ltd to 52-Week High of Rs 297.15
With a sustained six-day rally culminating in a fresh 52-week high of Rs 297.15 on 6 Jul 2026, Viyash Scientific Ltd has demonstrated remarkable price momentum, outpacing the broader Sensex which has gained 3.45% over the past three weeks. This surge reflects a confluence of bullish technical indicators and steady market conditions supporting the stock’s upward trajectory.
Read full news article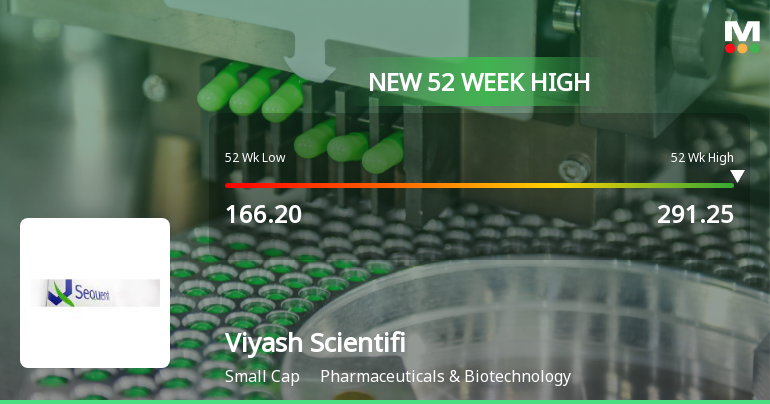
Broad-Based Technical Strength Lifts Viyash Scientific Ltd to 52-Week High of Rs 291.25
With a decisive break above Rs 291.25 on 2 Jul 2026, Viyash Scientific Ltd has reached a fresh 52-week high, extending its impressive 58.14% gain over the past year. This milestone comes amid a sustained rally supported by a confluence of bullish technical indicators and strong price momentum.
Read full news article Announcements
Shareholder Meeting / Postal Ballot-Scrutinizers Report
29-Jun-2026 | Source : BSEPostal Ballot Result and Scrutinizers Report
Closure of Trading Window
26-Jun-2026 | Source : BSENotice for Closure of Trading window
Announcement under Regulation 30 (LODR)-Investor Presentation
25-Jun-2026 | Source : BSEInvestor Presentation : Viyash Investor Day -2026
Corporate Actions

No Upcoming Board Meetings

Viyash Scientific Ltd has declared 25% dividend, ex-date: 08 Sep 21

Viyash Scientific Ltd has announced 2:10 stock split, ex-date: 25 Feb 16

No Bonus history available

No Rights history available
Quality key factors
Valuation key factors
Technicals key factors
 Technical Indicator Scale: Bearish, Mildly Bearish, Sideways, Mildly Bullish, Bullish Turned
 Shareholding Snapshot : Mar 2026
Shareholding Compare (%holding)
Promoters
None
Held by 7 Schemes (6.44%)
Held by 29 FIIs (2.94%)
Ca Hull Investments (31.17%)
Quant Mutual Fund - Quant Manufacturing Fund (6.09%)
18.97%
Quarterly Results Snapshot (Consolidated) - Mar'26 - YoY

YoY Growth in quarter ended Mar 2026 is 129.02% vs 11.21% in Mar 2025

YoY Growth in quarter ended Mar 2026 is 459.12% vs 1,113.04% in Mar 2025
Half Yearly Results Snapshot (Consolidated) - Sep'25
Growth in half year ended Sep 2025 is 14.04% vs 11.73% in Sep 2024
Growth in half year ended Sep 2025 is 218.53% vs 121.10% in Sep 2024
Nine Monthly Results Snapshot (Consolidated) - Dec'25
YoY Growth in nine months ended Dec 2025 is 12.46% vs 51.99% in Dec 2024
YoY Growth in nine months ended Dec 2025 is 25.61% vs 253.69% in Dec 2024
Annual Results Snapshot (Consolidated) - Mar'26
YoY Growth in year ended Mar 2026 is 13.75% vs 119.52% in Mar 2025
YoY Growth in year ended Mar 2026 is 663.48% vs 164.72% in Mar 2025
About Viyash Scientific Ltd

Company Coordinates


