
Compare Sunshield Chem. with Similar Stocks
Dashboard
With a growth in Net Profit of 118%, the company declared Very Positive results in Mar 26
- The company has declared positive results for the last 4 consecutive quarters
- PBT LESS OI(Q) At Rs 13.72 cr has Grown at 86.6% (vs previous 4Q average)
- PBDIT(Q) Highest at Rs 16.50 cr.
- OPERATING PROFIT TO NET SALES(Q) Highest at 15.05%
With ROE of 11.7, it has a Attractive valuation with a 4.2 Price to Book Value
Rising Promoter Confidence
Market Beating performance in long term as well as near term
Stock DNA
Specialty Chemicals
INR 1,073 Cr (Micro Cap)
36.00
41
0.25%
-0.06
11.74%
4.25
Total Returns (Price + Dividend) 
Latest dividend: 3 per share ex-dividend date: Jun-11-2026
Risk Adjusted Returns v/s
Returns Beta

News
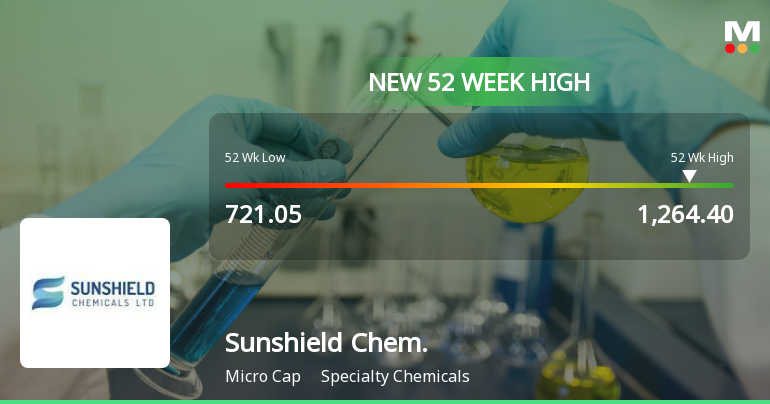
Broad-Based Technical Strength Lifts Sunshield Chemicals Ltd to 52-Week High of Rs 1264.4
With a decisive gap-up opening and a fresh 52-week high of Rs 1264.4 on 12 Jun 2026, Sunshield Chemicals Ltd has cemented its position as a strong momentum stock in the Specialty Chemicals sector. This milestone caps a remarkable 58.62% rally over the past year, significantly outperforming the Sensex, which has declined by 8.53% over the same period.
Read full news article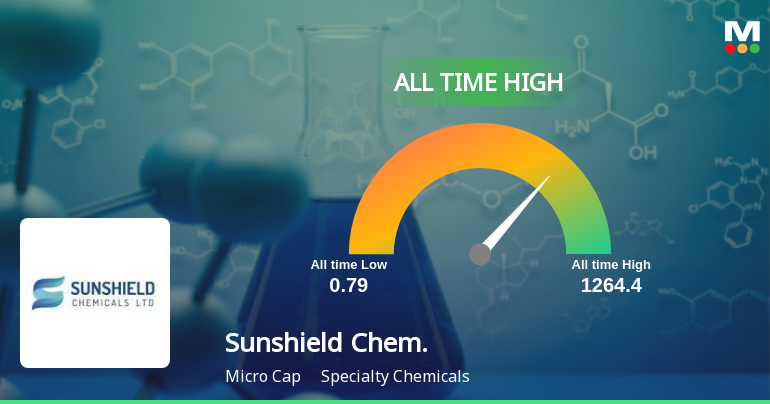
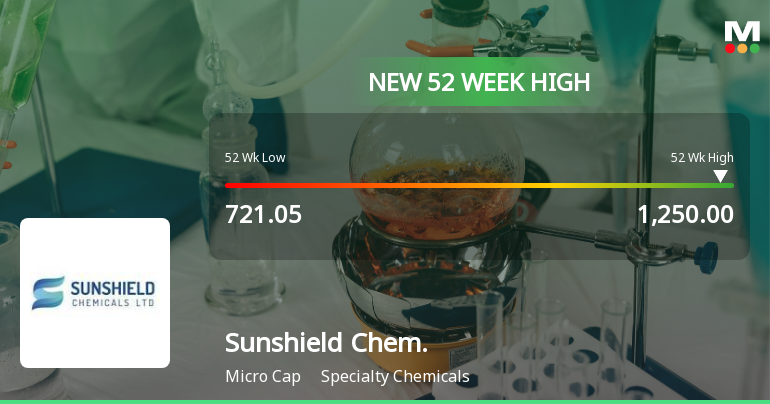
Broad-Based Technical Strength Lifts Sunshield Chemicals Ltd to 52-Week High of Rs 1250
With a decisive surge to Rs 1250 on 11 Jun 2026, Sunshield Chemicals Ltd has reached a fresh 52-week and all-time high, marking a significant milestone in its price momentum. This rally is underscored by a strong alignment of technical indicators and sustained earnings growth, setting the stage for a compelling momentum narrative.
Read full news article Announcements
Letters Sent To Shareholders
09-Jun-2026 | Source : BSEIn accordance with Regulation 36(1)(b) of SEBI (Listing Obligations & Disclosure Requirements) Regulations 2015 the Company has sent letter to those shareholders whose e-mail addresses are not registered. Copy of the letter is enclosed.
Announcement under Regulation 30 (LODR)-Newspaper Publication
09-Jun-2026 | Source : BSEWe are enclosing copies of newspaper advertisement in relation to 39th Annual General Meeting published in Financial Express (English Newspaper) and Mumbai Lakshdeep (Marathi Newspaper).
Notice Of 39Th Annual General Meeting Of The Company
08-Jun-2026 | Source : BSEPlease find attached notice of 39th Annual General Meeting scheduled to be held on 3rd July 2026 at 11.00 am through video conference or other audio-visual means.
Corporate Actions

No Upcoming Board Meetings

Sunshield Chemicals Ltd has declared 30% dividend, ex-date: 11 Jun 26

No Splits history available

No Bonus history available

Sunshield Chemicals Ltd has announced 10:51 rights issue, ex-date: 24 Sep 25
Quality key factors
Valuation key factors
Technicals key factors
 Technical Indicator Scale: Bearish, Mildly Bearish, Sideways, Mildly Bullish, Bullish Turned
 Shareholding Snapshot : Mar 2026
Shareholding Compare (%holding)
Promoters
None
Held by 1 Schemes (0.01%)
Held by 4 FIIs (8.46%)
Indus Petrochem Limited (62.36%)
Habrok India Master Lp (3.81%)
21.56%
Quarterly Results Snapshot (Standalone) - Mar'26 - QoQ

QoQ Growth in quarter ended Mar 2026 is 15.49% vs -22.42% in Dec 2025
QoQ Growth in quarter ended Mar 2026 is 118.00% vs -32.37% in Dec 2025
Half Yearly Results Snapshot (Standalone) - Sep'25
Growth in half year ended Sep 2025 is 38.28% vs 28.80% in Sep 2024
Growth in half year ended Sep 2025 is 95.14% vs -6.74% in Sep 2024
Nine Monthly Results Snapshot (Standalone) - Dec'25
YoY Growth in nine months ended Dec 2025 is 29.65% vs 29.13% in Dec 2024
YoY Growth in nine months ended Dec 2025 is 114.50% vs -31.28% in Dec 2024
Annual Results Snapshot (Standalone) - Mar'26

YoY Growth in year ended Mar 2026 is 20.54% vs 29.08% in Mar 2025
YoY Growth in year ended Mar 2026 is 103.16% vs -22.66% in Mar 2025
About Sunshield Chemicals Ltd

Company Coordinates


