
 Price Point
Compare Surat Trade with Similar Stocks
ScoreDashboard
Weak Long Term Fundamental Strength with a -35.50% CAGR growth in Operating Profits over the last 5 years
- Company's ability to service its debt is weak with a poor EBIT to Interest (avg) ratio of -3.96
- The company has been able to generate a Return on Equity (avg) of 9.43% signifying low profitability per unit of shareholders funds
With a growth in Operating Profit of 5136.36%, the company declared Outstanding results in Jun 26
With ROE of 5.3, it has a Attractive valuation with a 0.5 Price to Book Value
Majority shareholders : Promoters
Consistent Underperformance against the benchmark over the last 3 years
Mojo ParametersStock DNA

Garments & Apparels

INR 105 Cr (Micro Cap)

9.00
28

0.00%

-0.73

5.27%

0.46
Total ReturnsTotal Returns (Price + Dividend) 
Surat Trade for the last several years.
Risk Adjusted Returns v/s
Returns Beta
 News & Corporate Actions
News
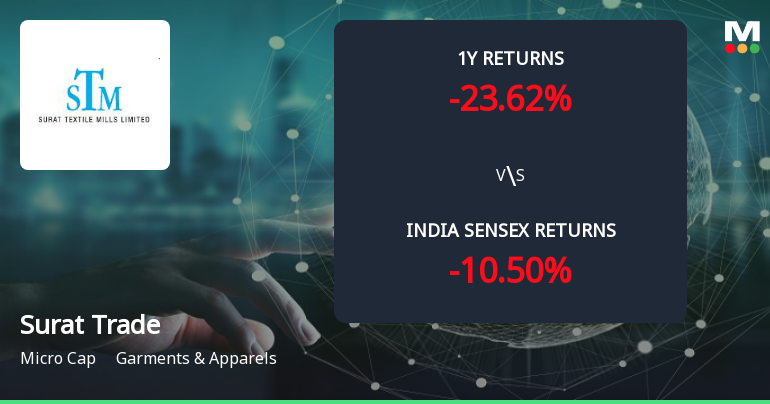
Golden Cross Forms in Surat Trade & Merchantile Ltd — On a Day the Stock Gained 1.74%. What the Mixed Signals Mean
The 50-day moving average has crossed above the 200-day moving average for Surat Trade & Merchantile Ltd, signalling a golden cross on 18 Jun 2026. Yet, the stock's modest 1.74% gain on the day contrasts with a complex technical backdrop, where weekly and monthly indicators send mixed messages. This divergence invites a closer examination of the signal's reliability.
Read full news article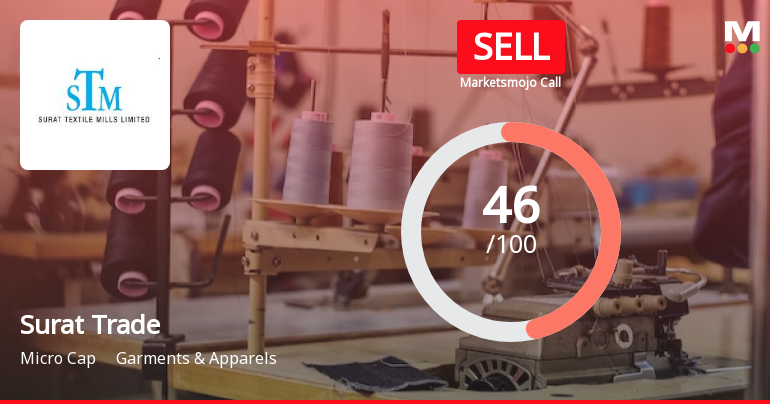
Surat Trade & Merchantile Ltd is Rated Sell
Surat Trade & Merchantile Ltd is rated 'Sell' by MarketsMOJO, with this rating last updated on 15 September 2026. However, the analysis and financial metrics discussed here reflect the stock's current position as of 17 September 2026, providing investors with the most up-to-date view of the company’s fundamentals, returns, and market performance.
Read full news article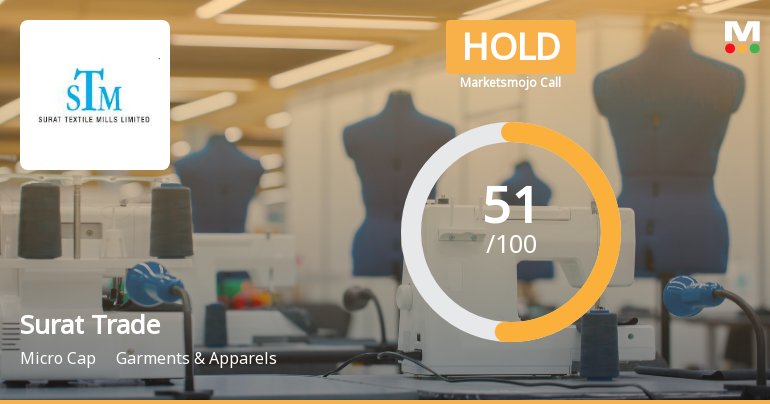
Surat Trade & Merchantile Ltd Upgraded to Hold on Technical Improvements and Strong Quarterly Results
Surat Trade & Merchantile Ltd, a micro-cap player in the Garments & Apparels sector, has seen its investment rating upgraded from Sell to Hold as of 2 September 2026. This change reflects a combination of improved technical indicators, robust quarterly financial performance, and an attractive valuation despite ongoing long-term fundamental challenges.
Read full news article Announcements
Announcement under Regulation 30 (LODR)-Newspaper Publication
28-Aug-2026 | Source : BSENewspaper Publications informing members regarding dispatch of Annual Report and Notice of AGM through email.
Submission Of Notice Of The 80Th Annual General Meeting Under Regulation 30 Of The SEBI (Listing Obligations And Disclosure Requirements) Regulations 2015
27-Aug-2026 | Source : BSESubmission of Notice of 80th Annual General Meeting
Reg. 34 (1) Annual Report.
27-Aug-2026 | Source : BSESubmission of Annual Report for the Financial Year 2025-26
Corporate Actions

No Upcoming Board Meetings

No Dividend history available

Surat Trade & Merchantile Ltd has announced 1:10 stock split, ex-date: 21 Feb 08

No Bonus history available

No Rights history available
Key FactorsQuality key factors
Valuation key factors
Technicals key factors
 Technical Indicator Scale: Bearish, Mildly Bearish, Sideways, Mildly Bullish, Bullish Turned Shareholding
Shareholding Snapshot : Jun 2026
Shareholding Compare (%holding)
Promoters
None
Held by 0 Schemes
Held by 0 FIIs
Alok Praful Shah (40.25%)
Garden Silk Mills Private Limited (2.5%)
27.31%
FinancialQuarterly Results Snapshot (Standalone) - Jun'26 - QoQ
 Compare with Peers
QoQ Growth in quarter ended Jun 2026 is 7.31% vs 303.42% in Mar 2026

QoQ Growth in quarter ended Jun 2026 is 2,297.73% vs -117.53% in Mar 2026

Half Yearly Results Snapshot (Standalone) - Sep'25
Growth in half year ended Sep 2025 is 14.91% vs 45.75% in Sep 2024
Growth in half year ended Sep 2025 is -7.67% vs 110.70% in Sep 2024
Nine Monthly Results Snapshot (Standalone) - Dec'25
YoY Growth in nine months ended Dec 2025 is 6.76% vs 31.23% in Dec 2024
YoY Growth in nine months ended Dec 2025 is -27.08% vs 118.72% in Dec 2024
Annual Results Snapshot (Standalone) - Mar'26
YoY Growth in year ended Mar 2026 is 62.22% vs 13.34% in Mar 2025
YoY Growth in year ended Mar 2026 is -5.83% vs 28.56% in Mar 2025
 Company CV
About Surat Trade & Merchantile Ltd

Company Coordinates










