
Compare Surya Roshni with Similar Stocks
Dashboard
Poor long term growth as Net Sales has grown by an annual rate of 6.28% and Operating profit at 5.26% over the last 5 years
Flat results in Mar 26
With ROE of 10.9, it has a Very Expensive valuation with a 2.2 Price to Book Value
Despite the size of the company, domestic mutual funds hold only 1.71% of the company
Underperformed the market in the last 1 year
Stock DNA
Iron & Steel Products
INR 5,926 Cr (Small Cap)
20.00
26
2.09%
-0.14
10.85%
2.17
Total Returns (Price + Dividend) 
Latest dividend: 2.5 per share ex-dividend date: Nov-17-2025
Risk Adjusted Returns v/s
Returns Beta

News

Surya Roshni Ltd is Rated Sell
Surya Roshni Ltd is rated 'Sell' by MarketsMOJO, with this rating last updated on 17 Nov 2025. However, the analysis and financial metrics presented here reflect the stock's current position as of 14 June 2026, providing investors with an up-to-date view of its fundamentals, valuation, financial trends, and technical outlook.
Read full news article
Surya Roshni Ltd is Rated Sell
Surya Roshni Ltd is rated 'Sell' by MarketsMOJO, with this rating last updated on 17 Nov 2025. However, the analysis and financial metrics discussed here reflect the stock's current position as of 03 June 2026, providing investors with an up-to-date perspective on the company’s performance and outlook.
Read full news article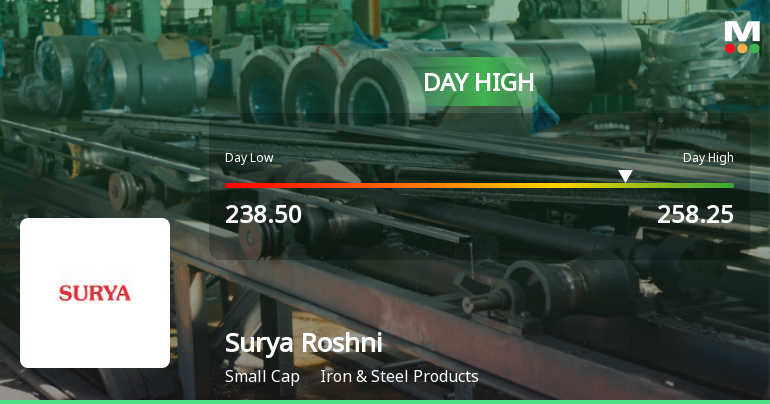
Surya Roshni Ltd Surges 7.55% to Day's High of Rs 249.7 — Outperforms Sector by 5.74 Percentage Points
The Sensex edged up a modest 0.12% on 1 Jun 2026, while Surya Roshni Ltd surged 7.55%, marking a standout session in the Iron & Steel Products sector. This 5.74-percentage-point outperformance over its sector peers signals a stock-specific momentum shift rather than a broad market rally.
Read full news article Announcements
Announcement under Regulation 30 (LODR)-Earnings Call Transcript
02-Jun-2026 | Source : BSEtranscript earning call (Group Meet) for the quarter and year ended 31st March 2026
Compliances-Certificate under Reg. 74 (5) of SEBI (DP) Regulations 2018
02-Jun-2026 | Source : BSEdematerialisation report for the month of May 2026
Announcement under Regulation 30 (LODR)-Newspaper Publication
02-Jun-2026 | Source : BSEease of doing investment - special window
Corporate Actions

No Upcoming Board Meetings

Surya Roshni Ltd has declared 50% dividend, ex-date: 17 Nov 25

Surya Roshni Ltd has announced 5:10 stock split, ex-date: 06 Oct 23

Surya Roshni Ltd has announced 1:1 bonus issue, ex-date: 01 Jan 25

No Rights history available
Quality key factors
Valuation key factors
Technicals key factors
 Technical Indicator Scale: Bearish, Mildly Bearish, Sideways, Mildly Bullish, Bullish Turned
 Shareholding Snapshot : Mar 2026
Shareholding Compare (%holding)
Promoters
None
Held by 7 Schemes (0.63%)
Held by 115 FIIs (4.68%)
Diwakar Marketing Private Limited (10.53%)
Henco Commercials Private Limited (2.36%)
21.02%
Quarterly Results Snapshot (Consolidated) - Mar'26 - QoQ

QoQ Growth in quarter ended Mar 2026 is 12.23% vs 4.46% in Dec 2025
QoQ Growth in quarter ended Mar 2026 is 23.35% vs 7.41% in Dec 2025
Half Yearly Results Snapshot (Consolidated) - Sep'25
Growth in half year ended Sep 2025 is 0.81% vs -9.73% in Sep 2024

Growth in half year ended Sep 2025 is -14.84% vs -6.31% in Sep 2024
Nine Monthly Results Snapshot (Consolidated) - Dec'25
YoY Growth in nine months ended Dec 2025 is 1.65% vs -7.66% in Dec 2024
YoY Growth in nine months ended Dec 2025 is -13.39% vs -3.88% in Dec 2024
Annual Results Snapshot (Consolidated) - Mar'26
YoY Growth in year ended Mar 2026 is 1.41% vs -4.78% in Mar 2025
YoY Growth in year ended Mar 2026 is -17.54% vs 5.30% in Mar 2025
About Surya Roshni Ltd

Company Coordinates


