
Compare Tarsons Products with Similar Stocks
Dashboard
Weak Long Term Fundamental Strength with a -39.98% CAGR growth in Operating Profits over the last 5 years
- The company has been able to generate a Return on Equity (avg) of 6.24% signifying low profitability per unit of shareholders funds
The company has declared Negative results for the last 4 consecutive quarters
Falling Participation by Institutional Investors
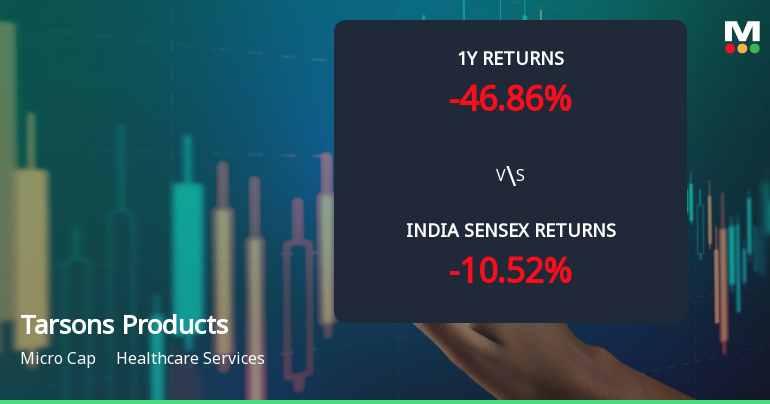
Consistent Underperformance against the benchmark over the last 3 years
Stock DNA
Healthcare Services
INR 1,101 Cr (Micro Cap)
72.00
35
0.00%
0.58
2.37%
1.68
Total Returns (Price + Dividend) 
Latest dividend: 2 per share ex-dividend date: Sep-20-2024
Risk Adjusted Returns v/s
Returns Beta

News
Tarsons Products Ltd Faces Bearish Momentum Amid Technical Downgrade
Tarsons Products Ltd, a micro-cap player in the Healthcare Services sector, has experienced a notable shift in its technical momentum, signalling increased bearishness. The stock’s recent price action, combined with mixed technical indicator readings, paints a challenging picture for investors amid a broader market context that has seen the company underperform the Sensex over multiple time frames.
Read full news article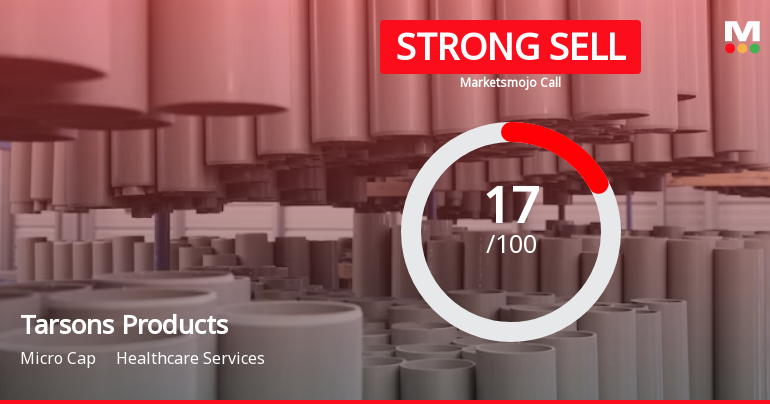
Tarsons Products Ltd is Rated Strong Sell
Tarsons Products Ltd is rated Strong Sell by MarketsMOJO, with this rating last updated on 25 May 2026. However, the analysis and financial metrics presented here reflect the stock's current position as of 03 June 2026, providing investors with the latest insights into the company’s performance and outlook.
Read full news article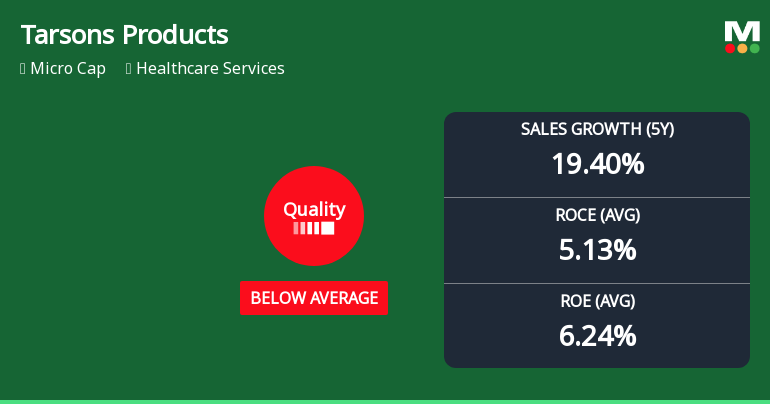
Tarsons Products Ltd Downgraded to Strong Sell Amid Deteriorating Quality Metrics
Tarsons Products Ltd, a micro-cap player in the Healthcare Services sector, has seen its quality grade downgraded from average to below average as of 25 May 2026. This shift reflects deteriorating business fundamentals, including weakening profitability metrics, stretched debt levels, and inconsistent growth patterns, which have raised concerns among investors and analysts alike.
Read full news article Announcements
Announcement under Regulation 30 (LODR)-Analyst / Investor Meet - Intimation
06-Jun-2026 | Source : BSEIntimation of Schedule of Analyst/Institutional Investor Meeting(s)
Announcement under Regulation 30 (LODR)-Analyst / Investor Meet - Intimation
06-Jun-2026 | Source : BSEIntimation of Schedule of Analyst/Institutional Investor Meeting(s)
Intimation Under Regulation 30 Of SEBI LODR Regulations 2015 Regarding Equity Investment.
03-Jun-2026 | Source : BSEIntimation under Regulation 30 read with Schedule III of SEBI (Listing Obligations and Disclosure Requirements) Regulations 2015.
Corporate Actions

No Upcoming Board Meetings

Tarsons Products Ltd has declared 100% dividend, ex-date: 20 Sep 24

No Splits history available

No Bonus history available

No Rights history available
Quality key factors
Valuation key factors
Technicals key factors
 Technical Indicator Scale: Bearish, Mildly Bearish, Sideways, Mildly Bullish, Bullish Turned
 Shareholding Snapshot : Mar 2026
Shareholding Compare (%holding)
Non Institution
None
Held by 2 Schemes (0.0%)
Held by 7 FIIs (0.87%)
Sanjive Sehgal (26.98%)
Clear Vision Investment Holdings Pte Limited (23.42%)
21.54%
Quarterly Results Snapshot (Consolidated) - Mar'26 - QoQ

QoQ Growth in quarter ended Mar 2026 is 12.09% vs 5.43% in Dec 2025

QoQ Growth in quarter ended Mar 2026 is -17.06% vs 51.81% in Dec 2025
Half Yearly Results Snapshot (Standalone) - Sep'25
Growth in half year ended Sep 2025 is 4.70% vs 12.48% in Sep 2024
Growth in half year ended Sep 2025 is -47.91% vs -13.44% in Sep 2024
Nine Monthly Results Snapshot (Standalone) - Dec'25
YoY Growth in nine months ended Dec 2025 is 6.63% vs 15.98% in Dec 2024
YoY Growth in nine months ended Dec 2025 is -36.33% vs -16.85% in Dec 2024
Annual Results Snapshot (Consolidated) - Mar'26
YoY Growth in year ended Mar 2026 is 7.67% vs 32.40% in Mar 2025
YoY Growth in year ended Mar 2026 is -51.90% vs -30.18% in Mar 2025
About Tarsons Products Ltd

Company Coordinates


