
Compare TCS with Similar Stocks
Dashboard
Strong Long Term Fundamental Strength with an average Return on Equity (ROE) of 48.29%
- Healthy long term growth as Net Sales has grown by an annual rate of 10.22%
- The company is Net-Debt Free
Flat results in Mar 26
With ROE of 49.1, it has a Attractive valuation with a 7 Price to Book Value
High Institutional Holdings at 23.08%
Consistent Underperformance against the benchmark over the last 3 years
Stock DNA
Computers - Software & Consulting
INR 754,643 Cr (Large Cap)
14.00
20
3.71%
-0.33
49.09%
7.18
Total Returns (Price + Dividend) 
Latest dividend: 11 per share ex-dividend date: Jan-16-2026
Risk Adjusted Returns v/s
Returns Beta

News
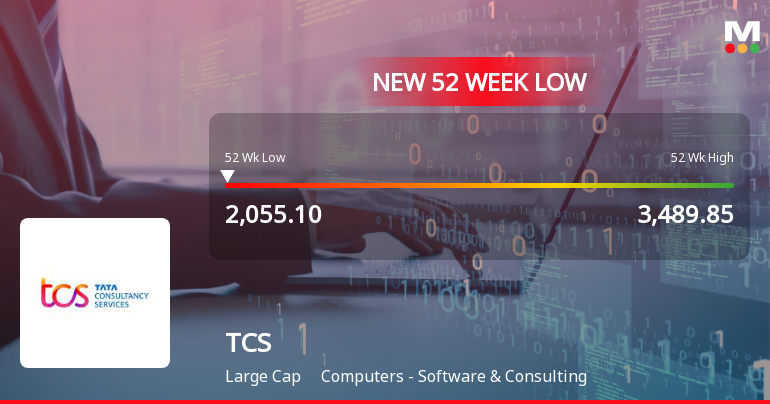
Tata Consultancy Services Ltd. Falls to 52-Week Low of Rs 2055.1 as Sell-Off Deepens
A sharp decline of 3.39% today dragged Tata Consultancy Services Ltd. to a fresh 52-week low of Rs 2055.1, marking a significant 41.1% drop from its 52-week high of Rs 3489.85. This latest sell-off extends the stock’s underperformance streak amid a broader market downturn.
Read full news article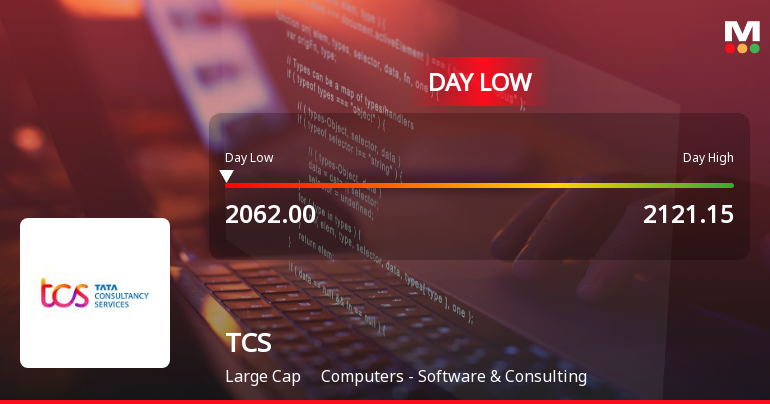
Tata Consultancy Services Ltd. Hits Intraday Low Amid Price Pressure
Tata Consultancy Services Ltd. (TCS) experienced a notable decline today, touching an intraday low of ₹2,062, reflecting a 3.07% drop as the stock faced significant price pressure amid broader market weakness and sector underperformance.
Read full news article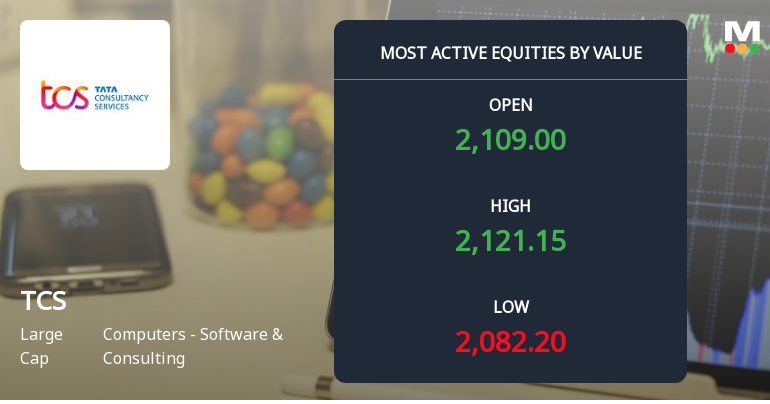
Tata Consultancy Services Ltd. Sees High-Value Trading Amid Market Pressure
Tata Consultancy Services Ltd. (TCS), a stalwart in the Computers - Software & Consulting sector, witnessed significant trading activity on 23 June 2026, with over 11 lakh shares exchanging hands and a total traded value exceeding ₹232 crore. Despite this high liquidity, the stock underperformed its sector and closed near its 52-week low, reflecting a cautious investor sentiment amid broader market dynamics.
Read full news article Announcements
Press Release - TCS Wins Multi-Year Deal To Transform Elopaks IT Operations
17-Jun-2026 | Source : BSETCS wins multi-year deal to transform Elopaks IT Operations
Press Release - Tottenham Hotspur Announces TCS As Digital Transformation Partner
16-Jun-2026 | Source : BSEPress Release - Tottenham Hotspur announces TCS as Digital Transformation Partner
Disclosure Under Regulation 30 Of The SEBI (Listing Obligations And Disclosure Requirements) Regulations 2015
16-Jun-2026 | Source : BSEDisclosure under Regulation 30 of the SEBI (LODR) Regulations 2015
Corporate Actions

09 Jul 2026

Tata Consultancy Services Ltd. has declared 1100% dividend, ex-date: 16 Jan 26

No Splits history available

Tata Consultancy Services Ltd. has announced 1:1 bonus issue, ex-date: 31 May 18

No Rights history available
Quality key factors
Valuation key factors
Technicals key factors
 Technical Indicator Scale: Bearish, Mildly Bearish, Sideways, Mildly Bullish, Bullish Turned
 Shareholding Snapshot : Mar 2026
Shareholding Compare (%holding)
Promoters
None
Held by 45 Schemes (5.77%)
Held by 1242 FIIs (9.66%)
Tata Sons Private Limited (71.74%)
Lic Of India (5.52%)
4.52%
Quarterly Results Snapshot (Consolidated) - Mar'26 - QoQ

QoQ Growth in quarter ended Mar 2026 is 5.38% vs 1.96% in Dec 2025
QoQ Growth in quarter ended Mar 2026 is 28.72% vs -11.74% in Dec 2025
Half Yearly Results Snapshot (Consolidated) - Sep'25

Growth in half year ended Sep 2025 is 1.86% vs 6.55% in Sep 2024
Growth in half year ended Sep 2025 is 3.70% vs 6.84% in Sep 2024
Nine Monthly Results Snapshot (Consolidated) - Dec'25
YoY Growth in nine months ended Dec 2025 is 2.87% vs 6.23% in Dec 2024
YoY Growth in nine months ended Dec 2025 is -2.30% vs 8.53% in Dec 2024
Annual Results Snapshot (Consolidated) - Mar'26
YoY Growth in year ended Mar 2026 is 4.58% vs 5.99% in Mar 2025
YoY Growth in year ended Mar 2026 is 1.35% vs 5.76% in Mar 2025
About Tata Consultancy Services Ltd.

Company Coordinates


