
Compare TCS with Similar Stocks
Dashboard
Strong Long Term Fundamental Strength with an average Return on Equity (ROE) of 48.29%
- Healthy long term growth as Net Sales has grown by an annual rate of 10.00%
- The company is Net-Debt Free
Flat results in Jun 26
With ROE of 49.1, it has a Fair valuation with a 8.2 Price to Book Value
High Institutional Holdings at 22.54%
Consistent Underperformance against the benchmark over the last 3 years
With its market cap of Rs 8,79,883 cr, it is the biggest company in the sector and constitutes 25.38% of the entire sector
Stock DNA
Computers - Software & Consulting
INR 854,737 Cr (Large Cap)
16.00
21
3.29%
-0.33
49.09%
8.20
Total Returns (Price + Dividend) 
Latest dividend: 12 per share ex-dividend date: Jul-15-2026
Risk Adjusted Returns v/s
Returns Beta

News
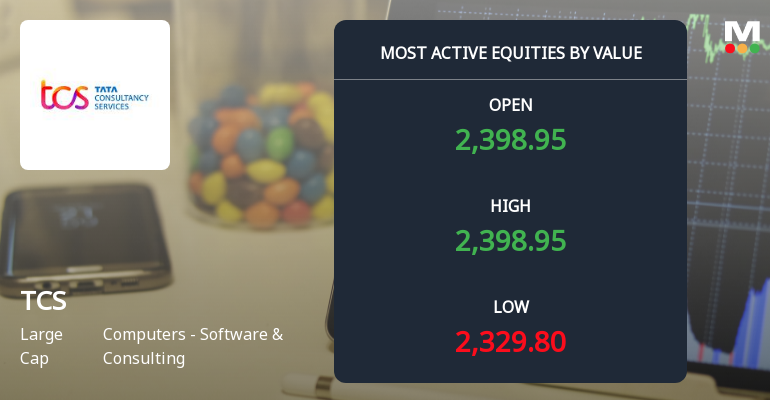
Tata Consultancy Services Ltd. Sees High Value Trading Amid Sector Weakness
Tata Consultancy Services Ltd. (TCS), a stalwart in the Computers - Software & Consulting sector, witnessed significant trading activity on 31 Jul 2026, with over 10 lakh shares exchanging hands and a total traded value exceeding ₹242 crore. Despite this high-value turnover, the stock underperformed its sector and recorded a notable decline, reflecting mixed investor sentiment amid broader IT sector weakness.
Read full news article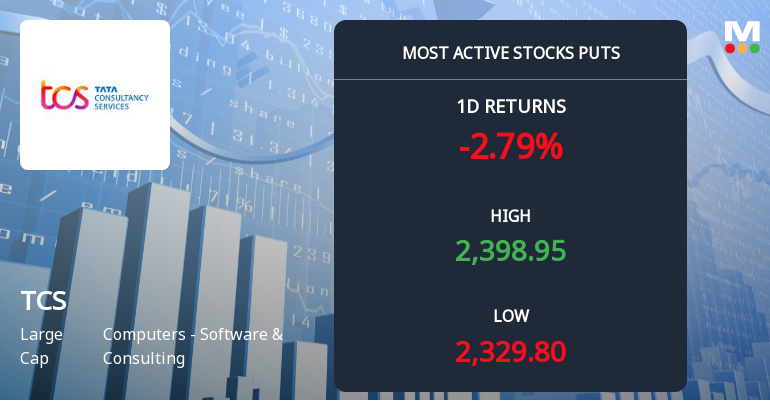
Rs 2,200 Puts — 6.8% Below Current Price — Draw 2,518 Contracts on Tata Consultancy Services Ltd.
Rs 2,200 put options on Tata Consultancy Services Ltd. (TCS) attracted 2,518 contracts on 31 Jul 2026, representing a strike price 6.8% below the current stock price of Rs 2,362.50. This sizeable activity, alongside other put strikes, suggests a nuanced picture of market positioning rather than a straightforward bearish outlook.
Read full news article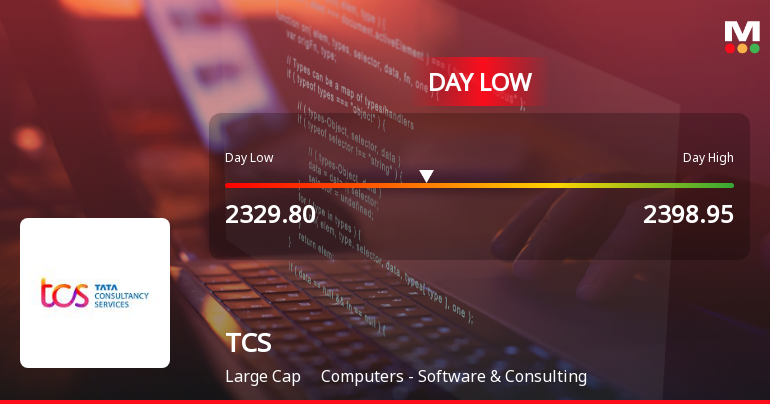
Tata Consultancy Services Ltd. Hits Intraday Low Amid Price Pressure
Tata Consultancy Services Ltd. (TCS) experienced a notable decline today, touching an intraday low of Rs 2,329.8, reflecting a 4.2% drop from previous levels. The stock underperformed its sector and broader market indices amid heightened volatility and persistent selling pressure.
Read full news article Announcements
Tata Consultancy Services Limited - Press Release
09-Dec-2019 | Source : NSETata Consultancy Services Limited has informed the Exchange regarding a press release dated December 09, 2019, titled "TCS Positioned as a Leader in Financial Crime and Compliance Operations Services by Everest Group".
Tata Consultancy Services Limited - Press Release
03-Dec-2019 | Source : NSETata Consultancy Services Limited has informed the Exchange regarding a press release dated December 02, 2019, titled "TCS Wins Corporate Social Responsibility Award for Ignite My Future in School Program".
Tata Consultancy Services Limited - Press Release
28-Nov-2019 | Source : NSETata Consultancy Services Limited has informed the Exchange regarding a press release dated November 28, 2019, titled "TCS to Power the Digital Experience at the Standard Chartered Singapore Marathon 2019".
Corporate Actions

No Upcoming Board Meetings

Tata Consultancy Services Ltd. has declared 1200% dividend, ex-date: 15 Jul 26

No Splits history available

Tata Consultancy Services Ltd. has announced 1:1 bonus issue, ex-date: 31 May 18

No Rights history available
Quality key factors
Valuation key factors
Technicals key factors
 Technical Indicator Scale: Bearish, Mildly Bearish, Sideways, Mildly Bullish, Bullish Turned
 Shareholding Snapshot : Jun 2026
Shareholding Compare (%holding)
Promoters
None
Held by 43 Schemes (5.68%)
Held by 1207 FIIs (9.06%)
Tata Sons Private Limited (71.74%)
Lic Of India (5.52%)
4.92%
Quarterly Results Snapshot (Consolidated) - Jun'26 - QoQ

QoQ Growth in quarter ended Jun 2026 is 2.23% vs 5.38% in Mar 2026
QoQ Growth in quarter ended Jun 2026 is -2.69% vs 28.72% in Mar 2026
Half Yearly Results Snapshot (Consolidated) - Sep'25
Growth in half year ended Sep 2025 is 1.86% vs 6.55% in Sep 2024
Growth in half year ended Sep 2025 is 3.70% vs 6.84% in Sep 2024
Nine Monthly Results Snapshot (Consolidated) - Dec'25
YoY Growth in nine months ended Dec 2025 is 2.87% vs 6.23% in Dec 2024
YoY Growth in nine months ended Dec 2025 is -2.30% vs 8.53% in Dec 2024
Annual Results Snapshot (Consolidated) - Mar'26
YoY Growth in year ended Mar 2026 is 4.58% vs 5.99% in Mar 2025
YoY Growth in year ended Mar 2026 is 1.35% vs 5.76% in Mar 2025
About Tata Consultancy Services Ltd.

Company Coordinates


