
Compare TCFC Finance with Similar Stocks
Stock DNA
Non Banking Financial Company (NBFC)
INR 29 Cr (Micro Cap)
NA (Loss Making)
20
0.00%
0.00
-1.61%
0.26
Total Returns (Price + Dividend) 
Latest dividend: 1.8 per share ex-dividend date: Jul-23-2024
Risk Adjusted Returns v/s
Returns Beta

News
Are TCFC Finance Ltd latest results good or bad?
TCFC Finance Ltd's latest financial results for Q4 FY26 reveal significant operational challenges, marked by a net loss of ₹5.54 crores and negative net sales of ₹7.87 crores. This quarter represents the company's lowest performance on record, with net sales declining sharply by 631.76% compared to the previous quarter and a year-on-year increase in losses of 118.01%. The operating profit before depreciation, interest, and tax (PBDIT) also fell to ₹-8.32 crores, indicating severe difficulties in generating positive cash flows from core activities. The company's return on equity (ROE) for this quarter stands at a low 0.60%, reflecting weak capital efficiency. Over the past two years, TCFC Finance's results have exhibited extreme volatility, with profits and losses swinging dramatically, underscoring the speculative nature of its trading-centric business model. The absence of institutional support, with inst...
Read full news article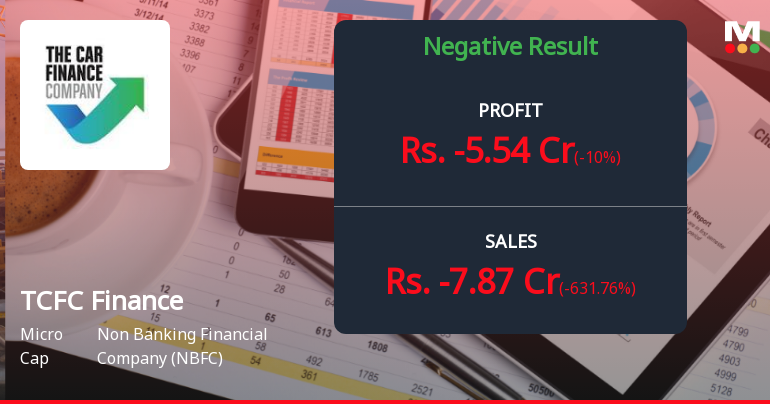
TCFC Finance Q4 FY26: Steep Losses Deepen as Trading Bets Backfire
TCFC Finance Ltd., a Mumbai-based non-banking finance company focused on proprietary trading and investments, reported a steep net loss of ₹5.54 crores for Q4 FY26, marking a dramatic reversal from the ₹1.74 crores profit posted in Q1 FY26. The micro-cap firm, with a market capitalisation of just ₹29.32 crores, has seen its shares plunge 45.16% over the past year, trading at ₹27.97 as of May 26, 2026—a stark reflection of mounting investor concerns over the company's deteriorating financial performance and volatile trading-driven business model.
Read full news articleAre TCFC Finance Ltd latest results good or bad?
The latest financial results for TCFC Finance Ltd for the quarter ended December 2025 reveal significant challenges within the company's operational framework. The company reported net sales of ₹1.48 crores, which reflects a substantial sequential swing from a negative ₹1.78 crores in the previous quarter. However, this figure represents a dramatic year-on-year decline of 460.98%, indicating ongoing difficulties in generating stable revenue. In terms of profitability, TCFC Finance recorded a net loss of ₹0.05 crores, contrasting sharply with a profit of ₹2.03 crores in the preceding quarter. This loss is compounded by an unusually high tax rate of 105.32%, which has further strained the company's financial position despite achieving positive operating profits of ₹1.02 crores. The operating margin for the quarter stood at 68.92%, but this figure is considered artificially inflated due to the low revenue bas...
Read full news article Announcements
Announcement under Regulation 30 (LODR)-Newspaper Publication
07-Jun-2026 | Source : BSEIntimation of Newspaper Advertisement for Trf of unclaimed Shares to IEPF
Intimation Regarding Approval Of Selective Capital Reduction And Cut-Off Date For Giving Effect To The Reduction
05-Jun-2026 | Source : BSEIntimation regarding Approval of Selective Capital Reduction and cut-off Date for giving Effect to the Reduction
Submission Of Revised Outcome Of Board Meeting In Compliance With The Regulation 30Of SEBI (Listing Obligations And Disclosure Requirements) Regulations 2015
05-Jun-2026 | Source : BSESubmission of Revised outcome of Board Meeting in compliance with the Regulation 30 of SEBI (LODR) Regulations 2015 held on 25th May 2026
Corporate Actions

No Upcoming Board Meetings

TCFC Finance Ltd has declared 18% dividend, ex-date: 23 Jul 24

No Splits history available

No Bonus history available

No Rights history available
Quality key factors
Valuation key factors
Technicals key factors
 Technical Indicator Scale: Bearish, Mildly Bearish, Sideways, Mildly Bullish, Bullish Turned
 Shareholding Snapshot : Mar 2026
Shareholding Compare (%holding)
Promoters
None
Held by 0 Schemes
Held by 0 FIIs
Greenstone Investments Pvt Ltd (42.92%)
None
19.77%
Quarterly Results Snapshot (Standalone) - Mar'26 - QoQ

QoQ Growth in quarter ended Mar 2026 is -631.76% vs 183.15% in Dec 2025
QoQ Growth in quarter ended Mar 2026 is -10,980.00% vs -102.46% in Dec 2025
Half Yearly Results Snapshot (Standalone) - Sep'25

Growth in half year ended Sep 2025 is -24.13% vs -32.84% in Sep 2024
Growth in half year ended Sep 2025 is -20.96% vs -28.70% in Sep 2024
Nine Monthly Results Snapshot (Standalone) - Dec'25
YoY Growth in nine months ended Dec 2025 is 6.07% vs -57.31% in Dec 2024
YoY Growth in nine months ended Dec 2025 is -12.68% vs -56.75% in Dec 2024
Annual Results Snapshot (Standalone) - Mar'26
YoY Growth in year ended Mar 2026 is -168.40% vs -86.78% in Mar 2025
YoY Growth in year ended Mar 2026 is -249.18% vs -90.07% in Mar 2025
About TCFC Finance Ltd

Company Coordinates


