
Compare The Invest.Trust with Similar Stocks
Stock DNA
Non Banking Financial Company (NBFC)
INR 491 Cr (Micro Cap)
17.00
20
0.00%
0.08
3.98%
0.66
Total Returns (Price + Dividend) 
Latest dividend: 0.5 per share ex-dividend date: Aug-16-2012
Risk Adjusted Returns v/s
Returns Beta

News

The Investment Trust of India Ltd is Rated Strong Sell
The Investment Trust of India Ltd is rated Strong Sell by MarketsMOJO. This rating was last updated on 31 July 2025. However, all fundamentals, returns, and financial metrics discussed below reflect the stock’s current position as of 10 June 2026, providing investors with the latest comprehensive analysis.
Read full news article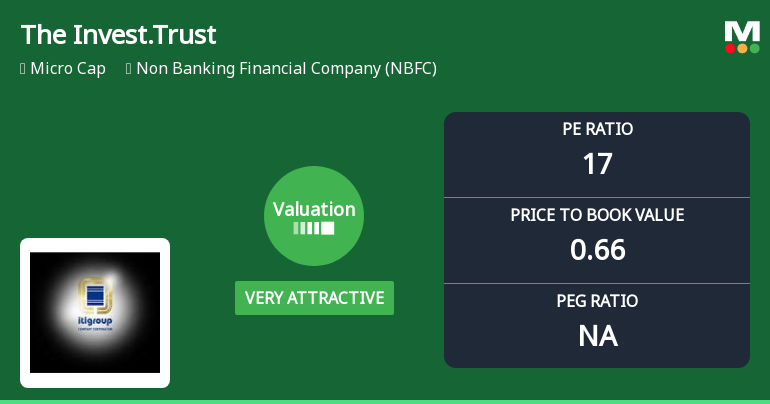
The Investment Trust of India Ltd: Valuation Shifts Signal Renewed Price Attractiveness Amid Market Challenges
The Investment Trust of India Ltd, a micro-cap player in the Non Banking Financial Company (NBFC) sector, has witnessed a significant shift in its valuation parameters, moving from an attractive to a very attractive rating. Despite recent price declines and underperformance against the Sensex, the stock’s improved price-to-earnings and price-to-book ratios suggest a compelling value proposition for discerning investors.
Read full news article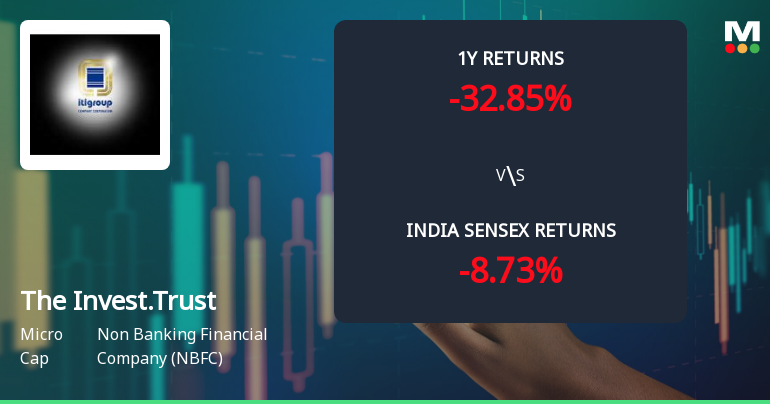
The Investment Trust of India Ltd Faces Bearish Momentum Amid Technical Downgrade
The Investment Trust of India Ltd, a micro-cap player in the Non Banking Financial Company (NBFC) sector, has experienced a notable shift in its technical momentum, signalling increased bearishness. Despite a brief weekly resilience, the stock’s monthly indicators and moving averages point to a deteriorating trend, with the MarketsMOJO rating downgraded to a Strong Sell as of 31 July 2025.
Read full news article Announcements
Update On Transfer Of Business To ITI Asset Management Limited A Wholly Owned Subsidiary Of The Company
01-Jun-2026 | Source : BSEWe wish to provide an update on transfer of investment management advisory and related fund management functions to ITI Asset Management Limited.
Announcement under Regulation 30 (LODR)-Newspaper Publication
20-May-2026 | Source : BSEThe newspaper advertisements for Special window for re-lodgement of transfer request of physical shares are published in Financial express (English language) and Navshakti (Marathi language) newspaper
Announcement under Regulation 30 (LODR)-Newspaper Publication
14-May-2026 | Source : BSESubmission of newspaper publication in regards to declaration of audited financial results (standalone and consolidated) for the quarter and year ended 31st March 2026
Corporate Actions

No Upcoming Board Meetings

The Investment Trust of India Ltd has declared 5% dividend, ex-date: 16 Aug 12

No Splits history available

The Investment Trust of India Ltd has announced 1:1 bonus issue, ex-date: 21 Mar 06

The Investment Trust of India Ltd has announced 4:5 rights issue, ex-date: 08 Feb 16
Quality key factors
Valuation key factors
Technicals key factors
 Technical Indicator Scale: Bearish, Mildly Bearish, Sideways, Mildly Bullish, Bullish Turned
 Shareholding Snapshot : Mar 2026
Shareholding Compare (%holding)
Promoters
None
Held by 0 Schemes
Held by 1 FIIs (6.55%)
Neostar Developers Llp (45.45%)
Elm Park Fund Limited (6.55%)
12.85%
Quarterly Results Snapshot (Consolidated) - Mar'26 - QoQ

QoQ Growth in quarter ended Mar 2026 is -35.42% vs 4.05% in Dec 2025
QoQ Growth in quarter ended Mar 2026 is -48.27% vs 307.90% in Dec 2025
Half Yearly Results Snapshot (Consolidated) - Sep'25
Growth in half year ended Sep 2025 is -18.04% vs 35.40% in Sep 2024
Growth in half year ended Sep 2025 is -63.17% vs 262.50% in Sep 2024
Nine Monthly Results Snapshot (Consolidated) - Dec'25
YoY Growth in nine months ended Dec 2025 is -10.65% vs 28.70% in Dec 2024
YoY Growth in nine months ended Dec 2025 is -34.91% vs 144.39% in Dec 2024
Annual Results Snapshot (Consolidated) - Mar'26
YoY Growth in year ended Mar 2026 is -19.39% vs 22.67% in Mar 2025
YoY Growth in year ended Mar 2026 is -29.27% vs 129.03% in Mar 2025
About The Investment Trust of India Ltd

Company Coordinates


