
Compare Timex Group with Similar Stocks
Dashboard
Strong ability to service debt as the company has a low Debt to EBITDA ratio of 0.05 times
Healthy long term growth as Net Sales has grown by an annual rate of 41.48% and Operating profit at 77.31%
With a growth in Net Profit of 195.89%, the company declared Outstanding results in Mar 26
Market Beating performance in long term as well as near term
Stock DNA
Gems, Jewellery And Watches
INR 5,479 Cr (Small Cap)
67.00
45
0.00%
-0.25
71.13%
47.65
Total Returns (Price + Dividend) 
Timex Group for the last several years.
Risk Adjusted Returns v/s
Returns Beta

News

Broad-Based Technical Strength Lifts Timex Group India Ltd to 52-Week High of Rs 548.55
Surging past its previous peaks, Timex Group India Ltd touched an all-time high of Rs 548.55 on 6 Jul 2026, marking a remarkable 136.7% gain over the past year. This milestone reflects a powerful confluence of technical momentum and sustained price strength that has propelled the stock well ahead of the broader market’s modest gains.
Read full news article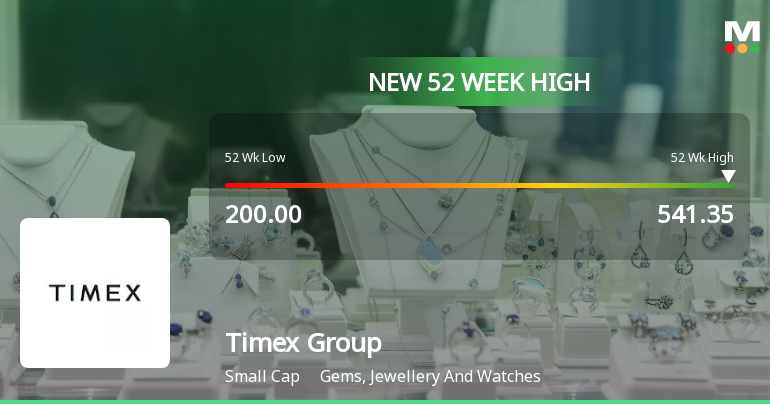
Broad-Based Technical Strength Lifts Timex Group India Ltd to 52-Week High of Rs 541.35
Surging past its previous peaks, Timex Group India Ltd touched a new 52-week high of Rs 541.35 on 3 Jul 2026, marking a remarkable rally from its 52-week low of Rs 200. This milestone reflects a sustained momentum driven by a confluence of bullish technical indicators and robust price action.
Read full news article
Broad-Based Technical Strength Lifts Timex Group India Ltd to 52-Week High of Rs 540
With a remarkable surge to Rs 540 on 30 Jun 2026, Timex Group India Ltd has reached a new 52-week and all-time high, propelled by a confluence of bullish technical indicators and sustained price momentum that outpaces its sector and the broader market.
Read full news article Announcements
Closure of Trading Window
24-Jun-2026 | Source : BSEPursuant to the provision of SEBI(PIT) Regulations 2015 and Timex Group India Limited-Code of Internal Procedures and Conduct for Regulating Monitoring and reporting of Trading by Insiders the Trading Window for dealing in the shares of the Company shall remain closed from July 1 2026 till July 31 2026(both days inclusive) on account of disclosure of un-audited financial results of the company for the quarter ending on June 30 2026.
Board Meeting Intimation for Considering And Approving The Un-Audited Financial Results Of The Company For The Quarter Ending On June 30 2026.
24-Jun-2026 | Source : BSETimex Group India Ltd-has informed BSE that the meeting of the Board of Directors of the Company is scheduled on 29/07/2026 inter alia to consider and approve the Un-audited Financial Results of the Company for the quarter ending on June 30 2026. Further pursuant to the provisions of SEBI (Prohibition of Insider Trading) Regulations 2015 and Timex Group India Limited - Code of Internal Procedures and Conduct for Regulating Monitoring and Reporting of Trading by Insiders the Trading Window for dealing in the shares of the Company shall remain closed from July 1 2026 till July 31 2026 (both days inclusive) on account of disclosure of Un-Audited Financial Results of the Company for the quarter ending on June 30 2026.
Announcement under Regulation 30 (LODR)-Analyst / Investor Meet - Intimation
22-Jun-2026 | Source : BSEPlease find attached details of Analyst/Investor Meet .
Corporate Actions

29 Jul 2026

No Dividend history available

No Splits history available

No Bonus history available

No Rights history available
Quality key factors
Valuation key factors
Technicals key factors
 Technical Indicator Scale: Bearish, Mildly Bearish, Sideways, Mildly Bullish, Bullish Turned
 Shareholding Snapshot : Mar 2026
Shareholding Compare (%holding)
Promoters
None
Held by 7 Schemes (0.06%)
Held by 15 FIIs (1.32%)
Timex Group Luxury Watches Bv (51.0%)
Chetan Jayantilal Shah (2.38%)
34.47%
Quarterly Results Snapshot (Standalone) - Mar'26 - YoY

YoY Growth in quarter ended Mar 2026 is 73.69% vs 47.09% in Mar 2025
YoY Growth in quarter ended Mar 2026 is 195.89% vs 30.51% in Mar 2025
Half Yearly Results Snapshot (Standalone) - Sep'25
Growth in half year ended Sep 2025 is 45.93% vs 21.53% in Sep 2024
Growth in half year ended Sep 2025 is 121.84% vs 32.72% in Sep 2024
Nine Monthly Results Snapshot (Standalone) - Dec'25
YoY Growth in nine months ended Dec 2025 is 39.91% vs 23.20% in Dec 2024
YoY Growth in nine months ended Dec 2025 is 116.86% vs 61.19% in Dec 2024
Annual Results Snapshot (Standalone) - Mar'26
YoY Growth in year ended Mar 2026 is 48.41% vs 28.45% in Mar 2025
YoY Growth in year ended Mar 2026 is 140.10% vs 50.77% in Mar 2025
About Timex Group India Ltd

Company Coordinates


