
 Price Point
Compare Tour. Fin. Corp. with Similar Stocks
ScoreDashboard
Weak Long Term Fundamental Strength with an average Return on Equity (ROE) of 8.81%
- Poor long term growth as Net Sales has grown by an annual rate of 2.18% and Operating profit at 4.75%
The company has declared Positive results for the last 3 consecutive quarters
With ROE of 11.7, it has a Very Expensive valuation with a 4.9 Price to Book Value
Increasing Participation by Institutional Investors
Consistent Returns over the last 3 years


 Total Returns
Total Returns (Price + Dividend) 
Latest dividend: 0.6 per share ex-dividend date: Aug-14-2026
Risk Adjusted Returns v/s
Returns Beta
 News & Corporate Actions
News
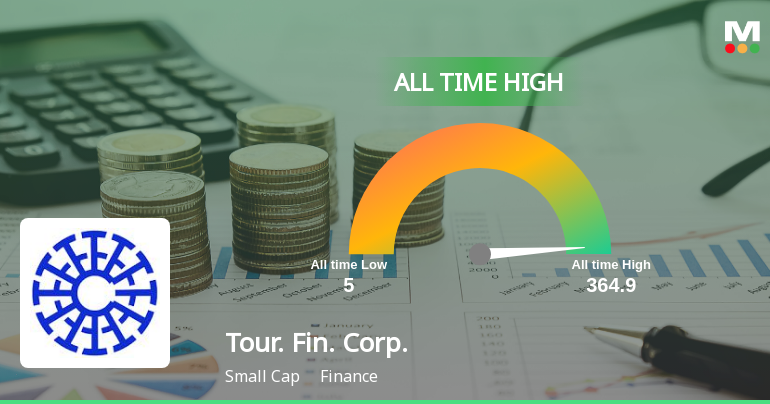

Tourism Finance Corporation of India Ltd is Rated Hold
Tourism Finance Corporation of India Ltd is rated 'Hold' by MarketsMOJO, with this rating last updated on 13 July 2026. However, the analysis and financial metrics discussed here reflect the stock's current position as of 30 September 2026, providing investors with an up-to-date view of its fundamentals, returns, and market performance.
Read full news article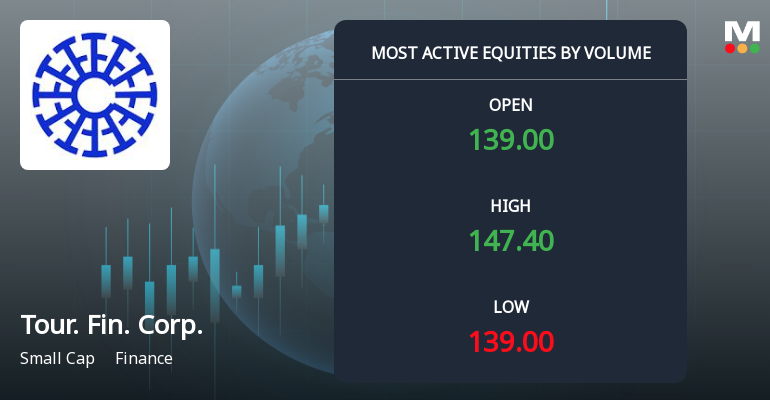
Tourism Finance Corporation of India Ltd Sees Exceptional Volume Surge Amid Positive Momentum
Tourism Finance Corporation of India Ltd (TFCILTD) emerged as one of the most actively traded stocks on 30 Sep 2026, registering a remarkable volume surge that coincided with a strong price rally. The stock outperformed its sector and broader market indices, signalling renewed investor interest and potential accumulation in this small-cap finance company.
Read full news article Announcements
Closure of Trading Window
25-Sep-2026 | Source : BSEClosure of Trading Window
Reply To Clarification Sought
23-Sep-2026 | Source : BSEReply to clarification sougnt
Clarification sought from Tourism Finance Corporation of India Ltd
23-Sep-2026 | Source : BSEThe Exchange has sought clarification from Tourism Finance Corporation of India Ltd on September 23 2026 with reference to Movement in Volume.
The reply is awaited.
Corporate Actions

No Upcoming Board Meetings

Tourism Finance Corporation of India Ltd has declared 30% dividend, ex-date: 14 Aug 26

Tourism Finance Corporation of India Ltd has announced 2:10 stock split, ex-date: 19 Sep 25

No Bonus history available

No Rights history available
Key FactorsQuality key factors
Valuation key factors
Technicals key factors
 Technical Indicator Scale: Bearish, Mildly Bearish, Sideways, Mildly Bullish, Bullish Turned Shareholding
Shareholding Snapshot : Jun 2026
Shareholding Compare (%holding)
Non Institution
None
Held by 1 Schemes (0.0%)
Held by 50 FIIs (5.46%)
Lici Asm Non Par (2.92%)
Aditya Kumar Halwasiya (6.99%)
38.66%
FinancialQuarterly Results Snapshot (Standalone) - Jun'26 - QoQ
 Compare with Peers
QoQ Growth in quarter ended Jun 2026 is 9.65% vs 6.10% in Mar 2026
QoQ Growth in quarter ended Jun 2026 is 91.16% vs 0.63% in Mar 2026

Half Yearly Results Snapshot (Standalone) - Sep'25

Growth in half year ended Sep 2025 is 3.00% vs 9.17% in Sep 2024
Growth in half year ended Sep 2025 is 16.95% vs 18.23% in Sep 2024
Nine Monthly Results Snapshot (Standalone) - Dec'25
YoY Growth in nine months ended Dec 2025 is 8.83% vs 2.15% in Dec 2024
YoY Growth in nine months ended Dec 2025 is 24.22% vs 4.10% in Dec 2024
Annual Results Snapshot (Standalone) - Mar'26
YoY Growth in year ended Mar 2026 is 8.77% vs 6.02% in Mar 2025
YoY Growth in year ended Mar 2026 is 18.93% vs 13.94% in Mar 2025
 Company CV
About Tourism Finance Corporation of India Ltd










