
Compare TRF with Similar Stocks
Stock DNA
Industrial Manufacturing
INR 284 Cr (Micro Cap)
37.00
38
0.00%
-1.29
8.20%
3.03
Total Returns (Price + Dividend) 
Latest dividend: 4 per share ex-dividend date: Jul-10-2012
Risk Adjusted Returns v/s
Returns Beta

News
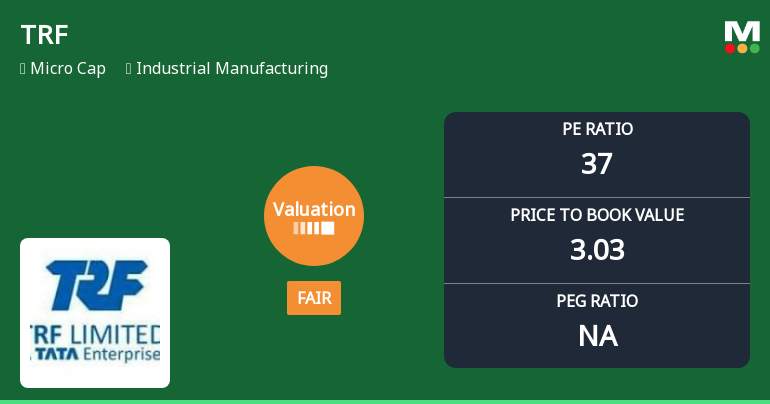
TRF Ltd Valuation Shifts to Fair Amidst Challenging Market Returns
TRF Ltd, a micro-cap player in the industrial manufacturing sector, has recently seen a notable shift in its valuation parameters, moving from an expensive to a fair valuation grade. This change comes amid a challenging market backdrop and a mixed performance relative to its peers and benchmark indices. Our comprehensive analysis delves into the implications of this valuation adjustment, examining key metrics such as price-to-earnings (P/E) and price-to-book value (P/BV) ratios, alongside peer comparisons and historical trends.
Read full news article
TRF Ltd is Rated Strong Sell
TRF Ltd is rated Strong Sell by MarketsMOJO, with this rating last updated on 16 June 2025. However, the analysis and financial metrics presented here reflect the company’s current position as of 22 June 2026, providing investors with an up-to-date view of the stock’s fundamentals, returns, and technical outlook.
Read full news article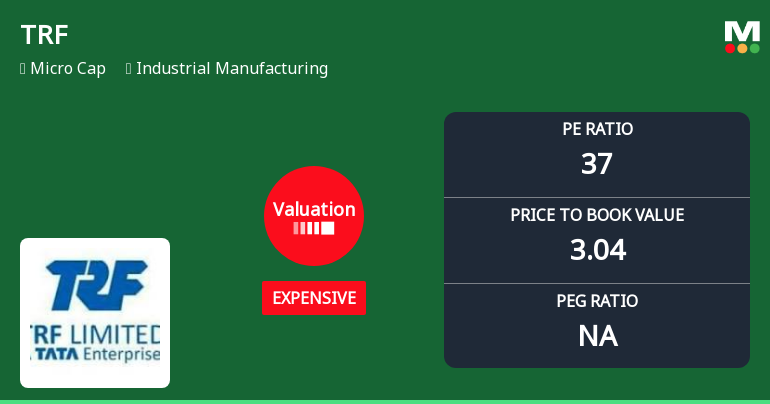
TRF Ltd Valuation Shifts Signal Price Attractiveness Challenges Amid Peer Comparison
TRF Ltd, a micro-cap player in the industrial manufacturing sector, has seen its valuation metrics shift notably over the past year, moving from fair to expensive territory. Despite a recent uptick in share price, the company’s price-to-earnings (P/E) and price-to-book value (P/BV) ratios now exceed peer averages, raising questions about price attractiveness amid mixed financial performance and market returns.
Read full news article Announcements
Disclosure Under Regulation 30 Of The SEBI(LODR) Regulation 2015
19-Jun-2026 | Source : BSEDisclosure under Regulation 30 of the SEBI(LODR) Regulation 2015
Shareholder Meeting / Postal Ballot-Outcome of Postal_Ballot
15-Jun-2026 | Source : BSEThe Results along with prescribed Annexures in relation to Postal Ballot notice dated May 12 2026 is enclosed.
Shareholder Meeting / Postal Ballot-Scrutinizers Report
15-Jun-2026 | Source : BSEThe Results along with the prescribed Annexures in relation to the Postal Ballot Notice dated May 12 2026 is enclosed.
Corporate Actions

No Upcoming Board Meetings

TRF Ltd has declared 40% dividend, ex-date: 10 Jul 12

No Splits history available

TRF Ltd has announced 1:1 bonus issue, ex-date: 31 Jul 09

No Rights history available
Quality key factors
Valuation key factors
Technicals key factors
 Technical Indicator Scale: Bearish, Mildly Bearish, Sideways, Mildly Bullish, Bullish Turned
 Shareholding Snapshot : Mar 2026
Shareholding Compare (%holding)
Non Institution
None
Held by 1 Schemes (0.0%)
Held by 2 FIIs (0.49%)
Tata Steel Limited (34.11%)
Roopa Corporate Services Pvt. Ltd. (2.84%)
50.85%
Quarterly Results Snapshot (Consolidated) - Mar'26 - YoY

YoY Growth in quarter ended Mar 2026 is -28.48% vs -28.66% in Mar 2025

YoY Growth in quarter ended Mar 2026 is -296.31% vs -44.13% in Mar 2025
Half Yearly Results Snapshot (Consolidated) - Sep'25
Growth in half year ended Sep 2025 is -34.92% vs -3.92% in Sep 2024
Growth in half year ended Sep 2025 is -129.97% vs -59.36% in Sep 2024
Nine Monthly Results Snapshot (Consolidated) - Dec'25
YoY Growth in nine months ended Dec 2025 is -29.88% vs -8.17% in Dec 2024
YoY Growth in nine months ended Dec 2025 is -89.05% vs -21.27% in Dec 2024
Annual Results Snapshot (Consolidated) - Mar'26
YoY Growth in year ended Mar 2026 is -29.57% vs -13.74% in Mar 2025
YoY Growth in year ended Mar 2026 is -117.33% vs -25.46% in Mar 2025
About TRF Ltd

Company Coordinates


