
Compare Trustedgecapital with Similar Stocks
Stock DNA
Non Banking Financial Company (NBFC)
INR 126 Cr (Micro Cap)
108.00
21
0.00%
0.18
0.98%
2.27
Total Returns (Price + Dividend) 
Trustedgecapital for the last several years.
Risk Adjusted Returns v/s
Returns Beta

News
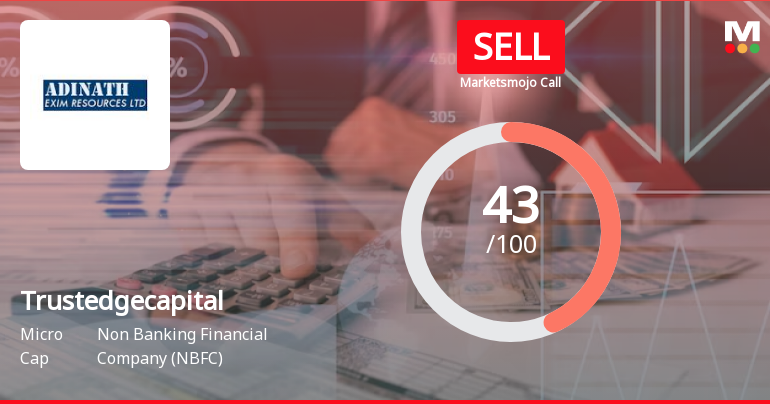
Trustedge Capital Ltd is Rated Sell
Trustedge Capital Ltd is rated 'Sell' by MarketsMOJO, with this rating last updated on 18 May 2026. However, the analysis and financial metrics discussed here reflect the stock's current position as of 30 July 2026, providing investors with an up-to-date view of the company’s fundamentals, valuation, financial trends, and technical outlook.
Read full news articleWhen is the next results date for Trustedge Capital Ltd?
The next results date for Trustedge Capital Ltd is scheduled for July 29, 2026....
Read full news article
Trustedge Capital Ltd is Rated Sell
Trustedge Capital Ltd is rated 'Sell' by MarketsMOJO, with this rating last updated on 18 May 2026. However, the analysis and financial metrics discussed here reflect the stock's current position as of 19 July 2026, providing investors with an up-to-date view of its fundamentals, valuation, financial trends, and technical outlook.
Read full news article Announcements
Results For The Quarter Ended On June 30 2026
29-Jul-2026 | Source : BSEResults for the quarter ended on June 30 2026
Board Meeting Outcome for Board Meeting Outcome
29-Jul-2026 | Source : BSEBoard Meeting outcome for the approval of unaudited financial results for the quarter ended on 30.06.2026
Intimation For Grant Of ESOP
29-Jul-2026 | Source : BSEIntimation for grant of ESOP under Trustedge Employee Stock Option Scheme 2025
Corporate Actions

No Upcoming Board Meetings

No Dividend history available

No Splits history available

No Bonus history available

Trustedge Capital Ltd has announced 49:85 rights issue, ex-date: 01 Oct 25
Quality key factors
Valuation key factors
Technicals key factors
 Technical Indicator Scale: Bearish, Mildly Bearish, Sideways, Mildly Bullish, Bullish Turned
 Shareholding Snapshot : Jun 2026
Shareholding Compare (%holding)
Promoters
None
Held by 0 Schemes
Held by 0 FIIs
Avani Dharen Savla (11.92%)
Jaydeep D Thakkar (1.28%)
21.42%
Quarterly Results Snapshot (Standalone) - Jun'26 - QoQ

QoQ Growth in quarter ended Jun 2026 is 21.43% vs 70.99% in Mar 2026
QoQ Growth in quarter ended Jun 2026 is -29.69% vs 357.14% in Mar 2026
Half Yearly Results Snapshot (Standalone) - Sep'25

Growth in half year ended Sep 2025 is 203.57% vs 7.69% in Sep 2024
Growth in half year ended Sep 2025 is -174.19% vs 10.71% in Sep 2024
Nine Monthly Results Snapshot (Standalone) - Dec'25
YoY Growth in nine months ended Dec 2025 is 262.65% vs 7.79% in Dec 2024
YoY Growth in nine months ended Dec 2025 is -120.00% vs 9.76% in Dec 2024
Annual Results Snapshot (Standalone) - Mar'26
YoY Growth in year ended Mar 2026 is 378.90% vs 5.83% in Mar 2025
YoY Growth in year ended Mar 2026 is 243.75% vs -71.43% in Mar 2025
About Trustedge Capital Ltd

Company Coordinates


