
Compare TVS Holdings with Similar Stocks
Dashboard
High Management Efficiency with a high ROCE of 16.79%
High Debt Company with a Debt to Equity ratio (avg) of 5.54 times
Healthy long term growth as Net Sales has grown by an annual rate of 23.43% and Operating profit at 34.76%
With a growth in Net Profit of 33.41%, the company declared Very Positive results in Mar 26
With ROCE of 20.8, it has a Very Attractive valuation with a 1.6 Enterprise value to Capital Employed
Majority shareholders : Promoters
Market Beating Performance
Stock DNA
Holding Company
INR 27,568 Cr (Small Cap)
16.00
37
0.64%
4.76
26.76%
4.22
Total Returns (Price + Dividend) 
Latest dividend: 85.75561404132732 per share ex-dividend date: Apr-02-2026
Risk Adjusted Returns v/s
Returns Beta

News
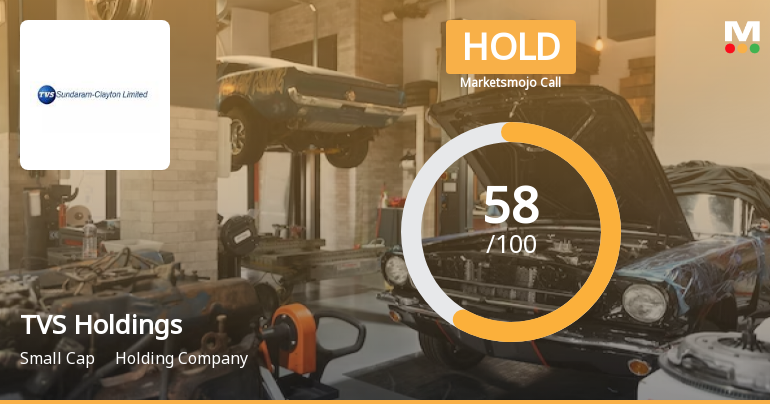
TVS Holdings Ltd is Rated Hold by MarketsMOJO
TVS Holdings Ltd is rated 'Hold' by MarketsMOJO, with this rating last updated on 04 June 2026. However, the analysis and financial metrics discussed here reflect the stock's current position as of 30 June 2026, providing investors with the latest insights into the company’s performance and outlook.
Read full news article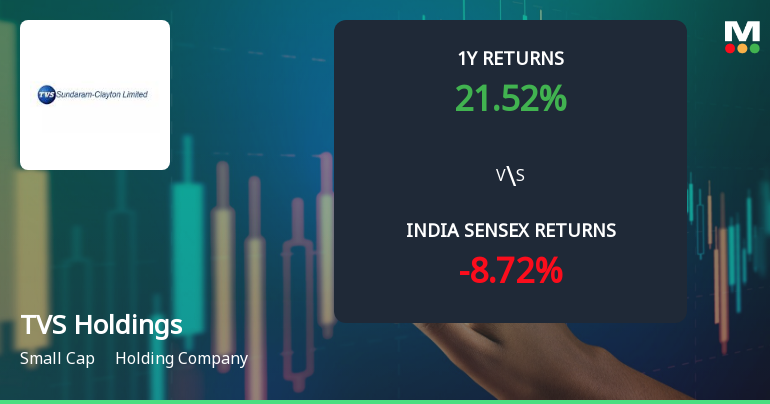
TVS Holdings Ltd Technical Momentum Shifts Amid Bearish Signals
TVS Holdings Ltd, a small-cap player in the holding company sector, has experienced a notable shift in its technical momentum, prompting a downgrade in its Mojo Grade from Strong Buy to Hold as of 4 June 2026. The stock’s price action and technical indicators reveal a transition from mildly bearish to bearish trends, signalling caution for investors amid mixed signals from key momentum oscillators and moving averages.
Read full news article
TVS Holdings Ltd is Rated Hold
TVS Holdings Ltd is rated 'Hold' by MarketsMOJO, with this rating last updated on 04 June 2026. However, the analysis and financial metrics discussed here reflect the stock's current position as of 19 June 2026, providing investors with an up-to-date view of the company’s fundamentals, returns, and market standing.
Read full news article Announcements
Sundaram Clayton Limited - Other General Purpose
15-Nov-2019 | Source : NSESundaram Clayton Limited has submitted to the Exchange a copy of Disclosure of Related Party Transactions pursuant to Regulation 23(9) of the SEBI (Listing Obligations and Disclosure Requirements) Regulations, 2015 for the half year ended September 30, 2019.
Sundaram Clayton Limited - Updates
25-Oct-2019 | Source : NSESundaram Clayton Limited has informed the Exchange regarding 'Information under Regulation 30 of the SEBI (Listing Obligations
Updates
23-Aug-2019 | Source : NSE
| Sundaram Clayton Limited has informed the Exchange regarding 'Information under Regulation 30 of the SEBI (Listing obligations and Disclosure Requirements) Regulations, 2015'. |
Corporate Actions

No Upcoming Board Meetings

TVS Holdings Ltd has declared 1720% dividend, ex-date: 02 Apr 26

No Splits history available

TVS Holdings Ltd has announced 116:1 bonus issue, ex-date: 24 Mar 23

No Rights history available
Quality key factors
Valuation key factors
Technicals key factors
 Technical Indicator Scale: Bearish, Mildly Bearish, Sideways, Mildly Bullish, Bullish Turned
 Shareholding Snapshot : Mar 2026
Shareholding Compare (%holding)
Promoters
16.9438
Held by 11 Schemes (7.53%)
Held by 124 FIIs (3.29%)
Vs Trust (mr Venu Srinivasan, Trustee) (66.55%)
Icici Prudential Mutual Fund (1.86%)
9.57%
Quarterly Results Snapshot (Consolidated) - Mar'26 - YoY

YoY Growth in quarter ended Mar 2026 is 32.09% vs 17.71% in Mar 2025
YoY Growth in quarter ended Mar 2026 is 49.87% vs 21.85% in Mar 2025
Half Yearly Results Snapshot (Consolidated) - Sep'25
Growth in half year ended Sep 2025 is 25.00% vs 8.14% in Sep 2024
Growth in half year ended Sep 2025 is 57.21% vs 16.68% in Sep 2024
Nine Monthly Results Snapshot (Consolidated) - Dec'25
YoY Growth in nine months ended Dec 2025 is 28.24% vs 9.89% in Dec 2024
YoY Growth in nine months ended Dec 2025 is 44.30% vs 35.85% in Dec 2024
Annual Results Snapshot (Consolidated) - Mar'26
YoY Growth in year ended Mar 2026 is 29.25% vs 12.82% in Mar 2025
YoY Growth in year ended Mar 2026 is 45.66% vs 45.45% in Mar 2025
About TVS Holdings Ltd

Company Coordinates


