
Compare Unimech Aero. with Similar Stocks
Dashboard
The company is Net-Debt Free
Poor long term growth as Operating profit has grown by an annual rate -19.15% of over the last 5 years
The company has declared Negative results for the last 3 consecutive quarters
With ROE of 8.6, it has a Very Expensive valuation with a 7.6 Price to Book Value
Despite the size of the company, domestic mutual funds hold only 0.78% of the company
Stock DNA
Aerospace & Defense
INR 5,991 Cr (Small Cap)
89.00
37
0.00%
-0.63
8.58%
7.63
Total Returns (Price + Dividend) 
Unimech Aero. for the last several years.
Risk Adjusted Returns v/s
Returns Beta

News
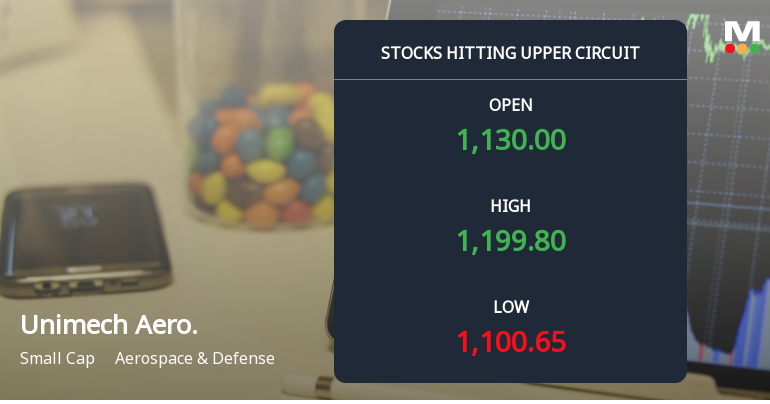
Unimech Aerospace and Manufacturing Ltd Locks at Upper Circuit With 7.15% Gain — Buyers Queue, Sellers Absent
At Rs 1,200.5, the buying was done — not because demand dried up, but because the exchange wouldn't let the stock go any higher. Unimech Aerospace and Manufacturing Ltd locked at its upper circuit of 7.15% on 29 Jun 2026, with buyers queuing and no sellers willing to part with shares.
Read full news article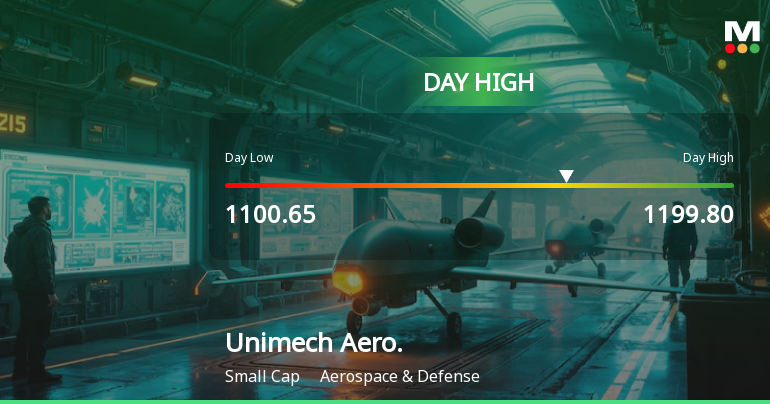
Unimech Aerospace and Manufacturing Ltd Surges 8.01% to Day's High of Rs 1170.4 — Outperforms Sector by 5.43 Percentage Points
The Sensex slipped 0.09% on 30 Jun 2026 while Unimech Aerospace and Manufacturing Ltd surged 8.01%, outperforming its Aerospace & Defense sector by 5.43 percentage points. This sharp single-session gain stands out as a stock-specific event amid a broadly weak market backdrop.
Read full news article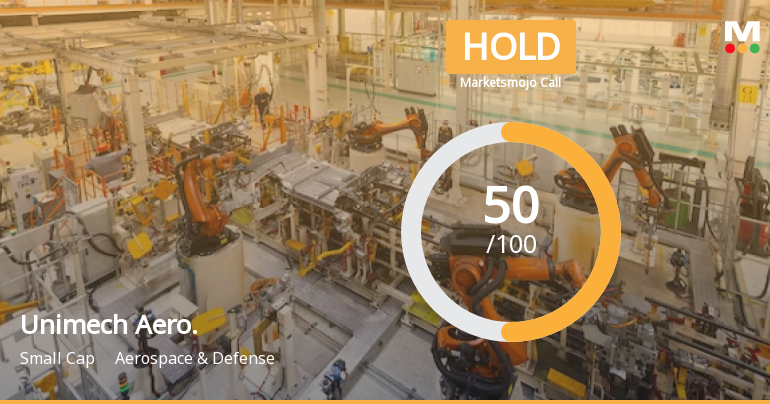
Unimech Aerospace and Manufacturing Ltd is Rated Hold
Unimech Aerospace and Manufacturing Ltd is rated 'Hold' by MarketsMOJO, with this rating last updated on 12 June 2026. However, the analysis and financial metrics discussed here reflect the stock's current position as of 26 June 2026, providing investors with the latest insights into the company’s performance and outlook.
Read full news article Announcements
Closure of Trading Window
26-Jun-2026 | Source : BSEIntimation of Closure of Trading Window
Announcement under Regulation 30 (LODR)-Analyst / Investor Meet - Intimation
06-Jun-2026 | Source : BSEIntimation of Schedule of Analyst/Institutional Investor Meeting under Regulation 30 read with Schedule III of SEBI (Listing Obligations and Disclosure Requirements) Regulations 2015
Announcement under Regulation 30 (LODR)-Earnings Call Transcript
03-Jun-2026 | Source : BSETranscript of Earnings call for the quarter and year ended March 31 2026.
Corporate Actions

No Upcoming Board Meetings

No Dividend history available

No Splits history available

No Bonus history available

No Rights history available
Quality key factors
Valuation key factors
Technicals key factors
 Technical Indicator Scale: Bearish, Mildly Bearish, Sideways, Mildly Bullish, Bullish Turned
 Shareholding Snapshot : Mar 2026
Shareholding Compare (%holding)
Promoters
None
Held by 4 Schemes (0.16%)
Held by 15 FIIs (0.38%)
Puttan Anil Kumar (26.24%)
Evolvence India Fund Iv Ltd (2.88%)
9.66%
Quarterly Results Snapshot (Consolidated) - Mar'26 - QoQ

QoQ Growth in quarter ended Mar 2026 is 142.59% vs -45.60% in Dec 2025
QoQ Growth in quarter ended Mar 2026 is 992.05% vs -84.75% in Dec 2025
Half Yearly Results Snapshot (Standalone) - Sep'25
Not Applicable: The company has declared_date for only one period
Not Applicable: The company has declared_date for only one period
Nine Monthly Results Snapshot (Standalone) - Dec'25
Not Applicable: The company has declared_date for only one period
Not Applicable: The company has declared_date for only one period
Annual Results Snapshot (Consolidated) - Mar'26

YoY Growth in year ended Mar 2026 is -1.00% vs 16.36% in Mar 2025
YoY Growth in year ended Mar 2026 is -24.18% vs 43.57% in Mar 2025
About Unimech Aerospace and Manufacturing Ltd

Company Coordinates


