
Compare Va Tech Wabag with Similar Stocks
Stock DNA
Other Utilities
INR 12,832 Cr (Small Cap)
35.00
13
0.19%
-0.32
14.57%
5.06
Total Returns (Price + Dividend) 
Latest dividend: 4.012239583333334 per share ex-dividend date: Aug-05-2025
Risk Adjusted Returns v/s
Returns Beta

News
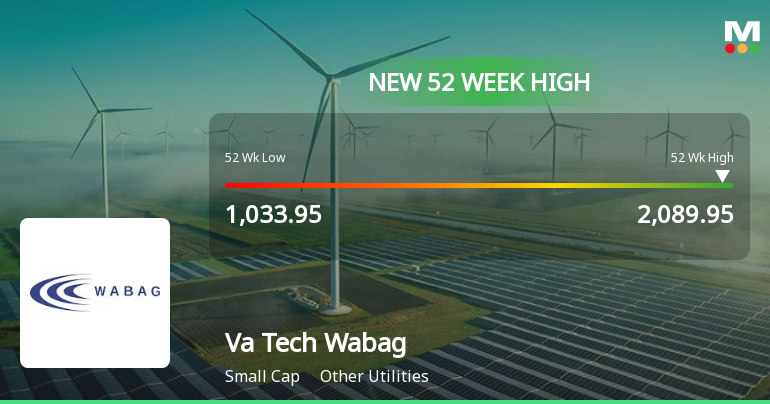
Broad-Based Technical Strength Lifts Va Tech Wabag Ltd to 52-Week High of Rs 2089.95
Surging past Rs 2089.95 on 23 Jun 2026, Va Tech Wabag Ltd has marked a significant milestone by reaching a fresh 52-week high. This rally is underpinned by a robust alignment of technical indicators and sustained price momentum, reflecting a strong uptrend that has propelled the stock well above its 52-week low of Rs 1033.95.
Read full news article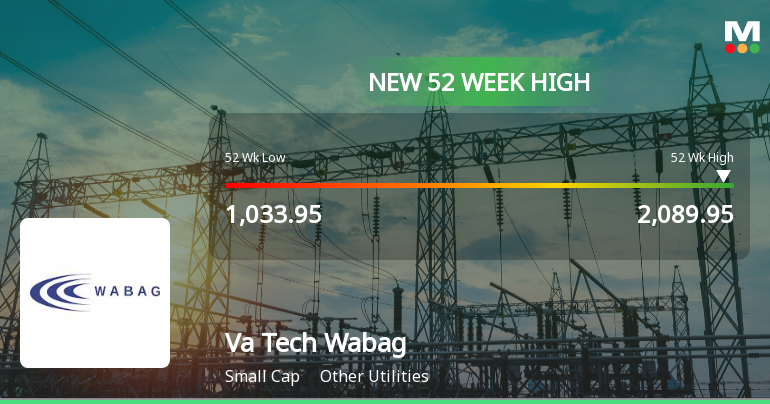
Broad-Based Technical Strength Lifts Va Tech Wabag Ltd to 52-Week High of Rs 2089.95
With a sustained rally that has propelled Va Tech Wabag Ltd to a new 52-week and all-time high of Rs 2089.95 on 23 Jun 2026, the stock’s momentum is unmistakable. This surge follows eight consecutive days of gains, delivering a remarkable 35.85% return in that period, far outpacing the broader market’s modest advances.
Read full news article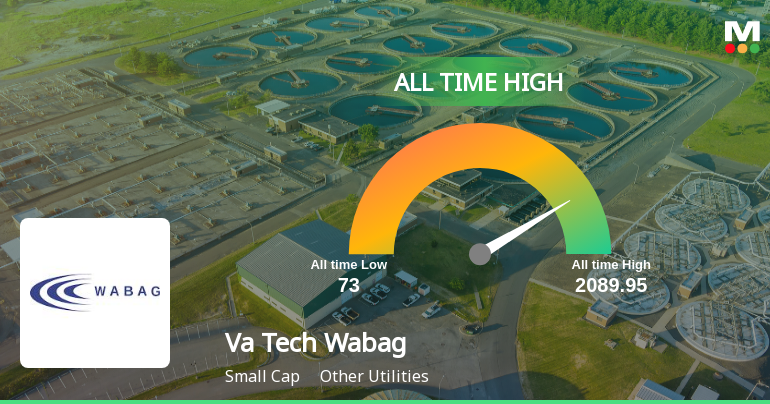
Announcements
Announcement under Regulation 30 (LODR)-Allotment of ESOP / ESPS
19-Jun-2026 | Source : BSEIntimation for allotment of 39113 Equity shares pursuant to exercise of stock options under Wabag Centenary Stock Option Scheme 2023
Intimation For Receipt Of Rectification Order From GST Authorities
19-Jun-2026 | Source : BSEIntimation for receipt of Rectification Order from GST Authorities
Announcement under Regulation 30 (LODR)-Award_of_Order_Receipt_of_Order
19-Jun-2026 | Source : BSEWABAG breaks new ground in Kuwait with a Mega SWRO Project
Corporate Actions

No Upcoming Board Meetings

Va Tech Wabag Ltd has declared 200% dividend, ex-date: 05 Aug 25

Va Tech Wabag Ltd has announced 2:5 stock split, ex-date: 16 Aug 11

Va Tech Wabag Ltd has announced 1:1 bonus issue, ex-date: 26 Mar 15

No Rights history available
Quality key factors
Valuation key factors
Technicals key factors
 Technical Indicator Scale: Bearish, Mildly Bearish, Sideways, Mildly Bullish, Bullish Turned
 Shareholding Snapshot : Mar 2026
Shareholding Compare (%holding)
Non Institution
None
Held by 11 Schemes (5.07%)
Held by 151 FIIs (16.6%)
Rajiv Mittal (15.58%)
Rekha Jhunjhunwala (8.02%)
48.12%
Quarterly Results Snapshot (Consolidated) - Mar'26 - YoY

YoY Growth in quarter ended Mar 2026 is 22.33% vs 23.76% in Mar 2025
YoY Growth in quarter ended Mar 2026 is 28.94% vs 37.43% in Mar 2025
Half Yearly Results Snapshot (Consolidated) - Sep'25

Growth in half year ended Sep 2025 is 18.22% vs 8.95% in Sep 2024
Growth in half year ended Sep 2025 is 19.90% vs 13.97% in Sep 2024
Nine Monthly Results Snapshot (Consolidated) - Dec'25
YoY Growth in nine months ended Dec 2025 is 18.34% vs 11.22% in Dec 2024
YoY Growth in nine months ended Dec 2025 is 23.75% vs 13.11% in Dec 2024
Annual Results Snapshot (Consolidated) - Mar'26
YoY Growth in year ended Mar 2026 is 19.74% vs 15.32% in Mar 2025
YoY Growth in year ended Mar 2026 is 25.47% vs 20.24% in Mar 2025
About Va Tech Wabag Ltd

Company Coordinates


