
Compare Vardhman Textile with Similar Stocks
Dashboard
Company has a Debt to Equity ratio (avg) of 0.10 times
Poor long term growth as Net Sales has grown by an annual rate of 9.96% over the last 5 years
The company has declared positive results in Jun'2026 after 2 consecutive negative quarters
With ROE of 7.1, it has a Very Expensive valuation with a 1.7 Price to Book Value
High Institutional Holdings at 20.76%
Market Beating Performance
With its market cap of Rs 18,179 cr, it is the second biggest company in the sector (behind K P R Mill Ltd)and constitutes 6.85% of the entire sector
Stock DNA
Garments & Apparels
INR 17,369 Cr (Small Cap)
24.00
25
0.80%
0.07
7.09%
1.73
Total Returns (Price + Dividend) 
Latest dividend: 5 per share ex-dividend date: Sep-12-2025
Risk Adjusted Returns v/s
Returns Beta

News

Vardhman Textiles Ltd is Rated Hold
Vardhman Textiles Ltd is rated 'Hold' by MarketsMOJO, with this rating last updated on 03 February 2026. However, the analysis and financial metrics discussed here reflect the company’s current position as of 22 July 2026, providing investors with an up-to-date view of its fundamentals, returns, and market standing.
Read full news article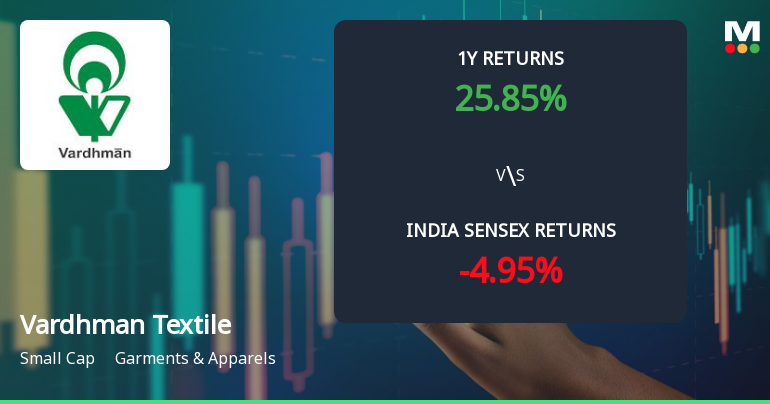
Vardhman Textiles Ltd Technical Momentum Shifts Amid Mixed Indicator Signals
Vardhman Textiles Ltd, a small-cap player in the Garments & Apparels sector, has experienced a nuanced shift in its technical momentum, moving from a bullish to a mildly bullish stance. Despite a slight dip in its share price to ₹630.20, the stock’s long-term performance remains robust, outpacing the Sensex over multiple time horizons. However, mixed signals from key technical indicators such as MACD, RSI, and moving averages suggest a cautious approach for investors analysing the stock’s near-term trajectory.
Read full news article
Vardhman Textiles Ltd is Rated Hold
Vardhman Textiles Ltd is rated 'Hold' by MarketsMOJO, with this rating last updated on 03 February 2026. However, the analysis and financial metrics discussed here reflect the stock's current position as of 11 July 2026, providing investors with an up-to-date view of the company’s performance and outlook.
Read full news article Announcements
Announcement under Regulation 30 (LODR)-Analyst / Investor Meet - Intimation
28-Jul-2026 | Source : BSEPlease find enclosed herewith intimation regarding the Conference Call of the Company scheduled to be held on 31.07.2026 at 4:00 p.m.
Board Meeting Intimation for Consideration And Approval Of The Un-Audited Financial Results Of The Company For The Quarter Ended 30Th June 2026.
25-Jul-2026 | Source : BSEVardhman Textiles Ltdhas informed BSE that the meeting of the Board of Directors of the Company is scheduled on 30/07/2026 inter alia to consider and approve the Un-Audited Financial Results of the Company for the quarter ended 30.06.2026.
Compliances-Certificate under Reg. 74 (5) of SEBI (DP) Regulations 2018
08-Jul-2026 | Source : BSEPlease find enclosed herewith certificate under Regulation 74(5) of the SEBI (DP) Regulations 2018.
Corporate Actions

(30 Jul 2026)

Vardhman Textiles Ltd has declared 250% dividend, ex-date: 12 Sep 25

Vardhman Textiles Ltd has announced 2:10 stock split, ex-date: 24 Mar 22

No Bonus history available

No Rights history available
Quality key factors
Valuation key factors
Technicals key factors
 Technical Indicator Scale: Bearish, Mildly Bearish, Sideways, Mildly Bullish, Bullish Turned
 Shareholding Snapshot : Jun 2026
Shareholding Compare (%holding)
Promoters
None
Held by 27 Schemes (12.43%)
Held by 138 FIIs (6.07%)
Vardhman Holdings Limited (28.97%)
Hdfc Small Cap Fund (6.12%)
11.66%
Quarterly Results Snapshot (Consolidated) - Jun'26 - QoQ

QoQ Growth in quarter ended Jun 2026 is 8.21% vs -0.29% in Mar 2026
QoQ Growth in quarter ended Jun 2026 is 67.74% vs 11.04% in Mar 2026
Half Yearly Results Snapshot (Consolidated) - Sep'25

Growth in half year ended Sep 2025 is 1.14% vs 2.02% in Sep 2024
Growth in half year ended Sep 2025 is -9.45% vs 60.78% in Sep 2024
Nine Monthly Results Snapshot (Consolidated) - Dec'25
YoY Growth in nine months ended Dec 2025 is 1.30% vs 3.28% in Dec 2024
YoY Growth in nine months ended Dec 2025 is -13.22% vs 49.87% in Dec 2024
Annual Results Snapshot (Consolidated) - Mar'26
YoY Growth in year ended Mar 2026 is 0.86% vs 2.95% in Mar 2025
YoY Growth in year ended Mar 2026 is -15.63% vs 39.85% in Mar 2025
About Vardhman Textiles Ltd

Company Coordinates


