
Compare Welspun Investme with Similar Stocks
Dashboard
The company is Net-Debt Free
Healthy long term growth as Net Sales has grown by an annual rate of 30.77%
Flat results in Mar 26
With ROE of 0.4, it has a Very Expensive valuation with a 0.9 Price to Book Value
Despite the size of the company, domestic mutual funds hold only 0.02% of the company
Consistent Returns over the last 3 years
Stock DNA
Non Banking Financial Company (NBFC)
INR 604 Cr (Micro Cap)
214.00
85
0.00%
0.00
0.41%
0.85
Total Returns (Price + Dividend) 
Welspun Investme for the last several years.
Risk Adjusted Returns v/s
Returns Beta

News
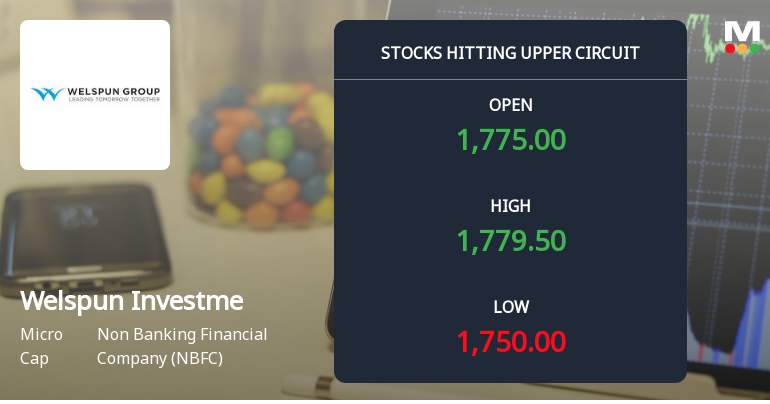
Welspun Investments & Commercials Ltd Locks at Upper Circuit With 5.0% Gain — Buyers Queue, Sellers Absent
At Rs 1779.5, the buying was done — not because demand dried up, but because the exchange wouldn't let the stock go any higher. Welspun Investments & Commercials Ltd locked at its upper circuit of 5.0% on 23 Jun 2026, with buyers queuing and no sellers willing to part with shares.
Read full news article
Welspun Investments & Commercials Ltd: Technical Momentum Shifts Amid Mixed Market Signals
Welspun Investments & Commercials Ltd, a micro-cap player in the Non Banking Financial Company (NBFC) sector, has experienced a notable shift in its technical parameters, reflecting a complex interplay of bullish and bearish signals. Despite a recent downgrade in daily price momentum, the stock’s longer-term technical indicators suggest a cautiously optimistic outlook, prompting a reassessment of its market positioning and investment potential.
Read full news article
Welspun Investments & Commercials Ltd is Rated Hold
Welspun Investments & Commercials Ltd is rated 'Hold' by MarketsMOJO, with this rating last updated on 25 May 2026. However, the analysis and financial metrics discussed here reflect the stock's current position as of 20 June 2026, providing investors with an up-to-date view of the company's performance and outlook.
Read full news article Announcements
Compliances-Reg.24(A)-Annual Secretarial Compliance
29-May-2026 | Source : BSEPlease find attached Annual Secretarial Compliance Report u/r 24A of LODR for the year ended March 31 2026
Announcement under Regulation 30 (LODR)-Newspaper Publication
27-May-2026 | Source : BSEPlease find attached herewith the Newspaper Publication for Audited Financial Results for the year ended March 31 2026
Board Meeting Outcome for Outcome Of Board Meeting
22-May-2026 | Source : BSEPursuant to Regulation 30 of the Securities and Exchange Board of India (Listing Obligations and Disclosure Requirements) Regulations 2015 as amended (SEBI Listing Regulations) we wish to inform you that the Board in its meeting held today i.e. May 22 2026 has considered and approved among others the following: A) Appointment of M/s Sureka Associates as Internal Auditor for one year; B) Directors Report for the year ended March 31 2026 and its Annexures;
Corporate Actions

No Upcoming Board Meetings

No Dividend history available

No Splits history available

No Bonus history available

No Rights history available
Quality key factors
Valuation key factors
Technicals key factors
 Technical Indicator Scale: Bearish, Mildly Bearish, Sideways, Mildly Bullish, Bullish Turned
 Shareholding Snapshot : Mar 2026
Shareholding Compare (%holding)
Promoters
None
Held by 3 Schemes (0.01%)
Held by 0 FIIs
Balkrishan Goenka, Trustee Of Welspun Group Master Trust (73.35%)
Ravi Vasudeo Goenka (3.11%)
15.26%
Quarterly Results Snapshot (Standalone) - Mar'26 - YoY

YoY Growth in quarter ended Mar 2026 is 116.67% vs -40.00% in Mar 2025

YoY Growth in quarter ended Mar 2026 is 0.00% vs 100.00% in Mar 2025
Half Yearly Results Snapshot (Standalone) - Sep'25
Growth in half year ended Sep 2025 is -1.20% vs 28.87% in Sep 2024
Growth in half year ended Sep 2025 is -9.62% vs 30.47% in Sep 2024
Nine Monthly Results Snapshot (Standalone) - Dec'25
YoY Growth in nine months ended Dec 2025 is -2.31% vs 29.10% in Dec 2024
YoY Growth in nine months ended Dec 2025 is -14.82% vs 30.63% in Dec 2024
Annual Results Snapshot (Standalone) - Mar'26
YoY Growth in year ended Mar 2026 is -0.95% vs 27.12% in Mar 2025
YoY Growth in year ended Mar 2026 is -18.11% vs 33.09% in Mar 2025
About Welspun Investments & Commercials Ltd

Company Coordinates


