
Compare Whirlpool India with Similar Stocks
Stock DNA
Electronics & Appliances
INR 10,152 Cr (Small Cap)
33.00
54
0.62%
-0.60
7.65%
2.45
Total Returns (Price + Dividend) 
Latest dividend: 5 per share ex-dividend date: Aug-29-2025
Risk Adjusted Returns v/s
Returns Beta

News
Whirlpool of India Ltd Upgraded to Sell Amid Mixed Financial and Technical Signals
Whirlpool of India Ltd has seen its investment rating upgraded from Strong Sell to Sell, driven primarily by a shift in technical indicators amid ongoing financial headwinds. While the company continues to face significant challenges in profitability and long-term growth, recent technical trends have improved enough to warrant a less severe rating, reflecting a nuanced outlook for investors.
Read full news article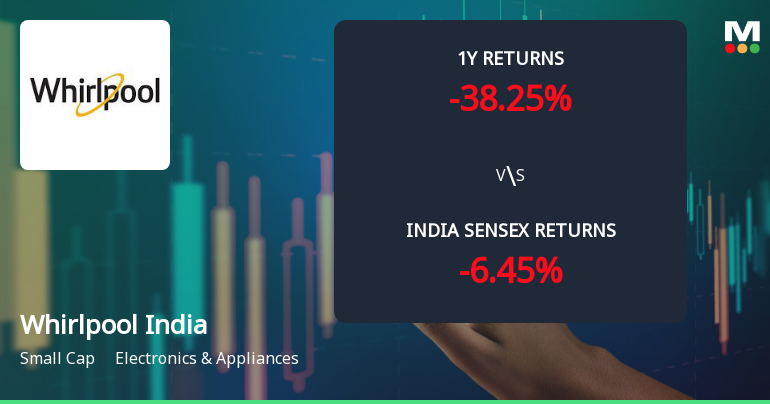
Whirlpool of India Ltd Technical Momentum Shifts Amid Mixed Market Signals
Whirlpool of India Ltd has experienced a subtle shift in its technical momentum, moving from a strongly bearish stance to a mildly bearish trend, reflecting a complex interplay of technical indicators. Despite a modest day gain of 2.67%, the stock remains under pressure with a Mojo Grade of Sell, signalling cautious sentiment among investors in the Electronics & Appliances sector.
Read full news article
Whirlpool of India Ltd is Rated Strong Sell
Whirlpool of India Ltd is rated Strong Sell by MarketsMOJO, with this rating last updated on 03 June 2026. However, the analysis and financial metrics discussed here reflect the stock’s current position as of 15 June 2026, providing investors with the latest insights into the company’s performance and outlook.
Read full news article Announcements
Shareholder Meeting / Postal Ballot-Outcome of Postal_Ballot
15-Jun-2026 | Source : BSEAs enclosed
Shareholder Meeting / Postal Ballot-Scrutinizers Report
15-Jun-2026 | Source : BSEAs enclosed
Announcement Under Regulation 30 (LODR) - General Update
10-Jun-2026 | Source : BSEAs enclosed
Corporate Actions

No Upcoming Board Meetings

Whirlpool of India Ltd has declared 50% dividend, ex-date: 29 Aug 25

No Splits history available

No Bonus history available

No Rights history available
Quality key factors
Valuation key factors
Technicals key factors
 Technical Indicator Scale: Bearish, Mildly Bearish, Sideways, Mildly Bullish, Bullish Turned
 Shareholding Snapshot : Mar 2026
Shareholding Compare (%holding)
Promoters
None
Held by 27 Schemes (32.33%)
Held by 157 FIIs (11.47%)
Whirlpool Mauritius Ltd (39.76%)
Nippon Life India Trustee Ltd-a/c Nippon India Small Cap Fund (7.89%)
10.02%
Quarterly Results Snapshot (Consolidated) - Mar'26 - YoY

YoY Growth in quarter ended Mar 2026 is 8.78% vs 15.61% in Mar 2025
YoY Growth in quarter ended Mar 2026 is -32.72% vs 53.63% in Mar 2025
Half Yearly Results Snapshot (Consolidated) - Sep'25
Growth in half year ended Sep 2025 is -3.09% vs 18.25% in Sep 2024
Growth in half year ended Sep 2025 is -4.48% vs 75.70% in Sep 2024
Nine Monthly Results Snapshot (Consolidated) - Dec'25
YoY Growth in nine months ended Dec 2025 is -1.04% vs 16.07% in Dec 2024
YoY Growth in nine months ended Dec 2025 is -10.95% vs 71.96% in Dec 2024
Annual Results Snapshot (Consolidated) - Mar'26
YoY Growth in year ended Mar 2026 is 1.45% vs 15.95% in Mar 2025
YoY Growth in year ended Mar 2026 is -18.18% vs 65.41% in Mar 2025
About Whirlpool of India Ltd

Company Coordinates


